
RColorBrewer is an R package that contains a ready-to-use color palettes for creating beautiful graphics.
This article presents the different color palettes available in the RColorBrewer package. You will also learn how to use these palettes in ggplot2 and in R base plots.
Contents:
Install and load RcolorBrewer package
To install the package, type the following R code in the console:
install.packages("RColorBrewer")Load the package as follow:
library(RColorBrewer)Display all brewer palettes
To display all the color palettes in the package, type this:
display.brewer.all()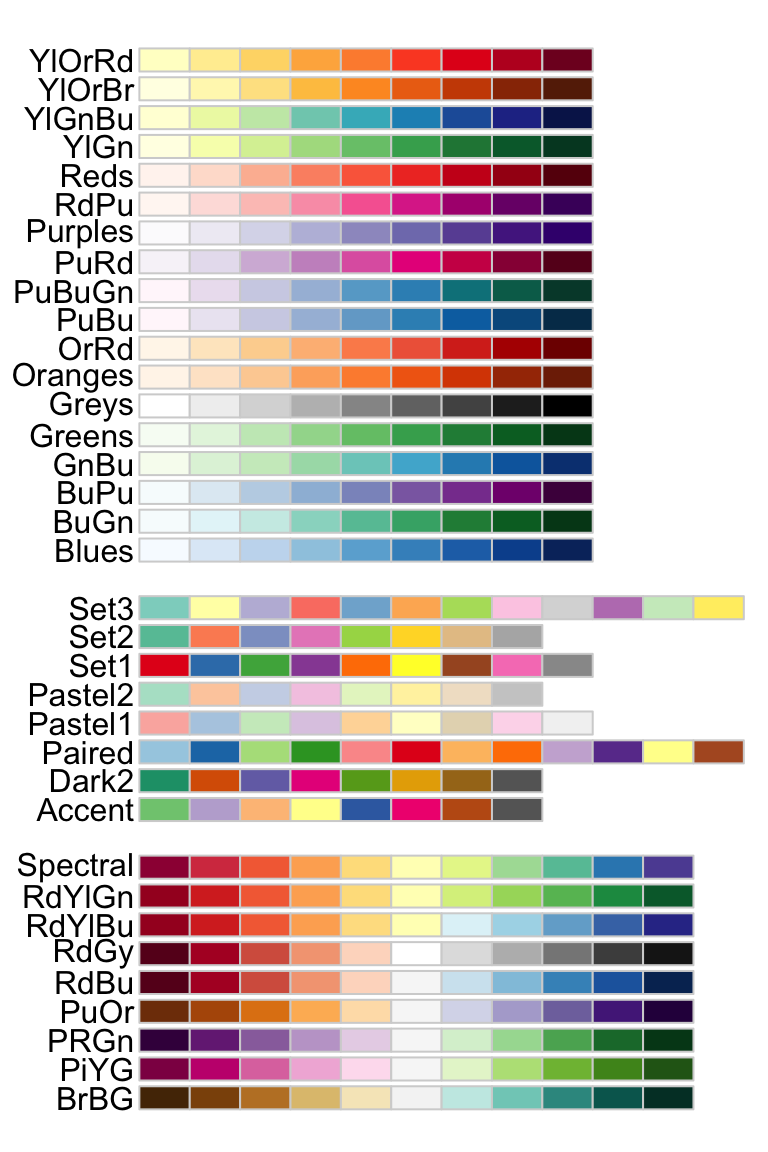
The package contains 3 types of color palettes: sequential, diverging, and qualitative.
- Sequential palettes (first list of colors), which are suited to ordered data that progress from low to high (gradient). The palettes names are : Blues, BuGn, BuPu, GnBu, Greens, Greys, Oranges, OrRd, PuBu, PuBuGn, PuRd, Purples, RdPu, Reds, YlGn, YlGnBu YlOrBr, YlOrRd.
- Qualitative palettes (second list of colors), which are best suited to represent nominal or categorical data. They not imply magnitude differences between groups. The palettes names are : Accent, Dark2, Paired, Pastel1, Pastel2, Set1, Set2, Set3.
- Diverging palettes (third list of colors), which put equal emphasis on mid-range critical values and extremes at both ends of the data range. The diverging palettes are : BrBG, PiYG, PRGn, PuOr, RdBu, RdGy, RdYlBu, RdYlGn, Spectral
Show only colorblind-friendly brewer palettes
To display only colorblind-friendly brewer palettes, specify the option colorblindFriendly = TRUE as follow:
display.brewer.all(colorblindFriendly = TRUE)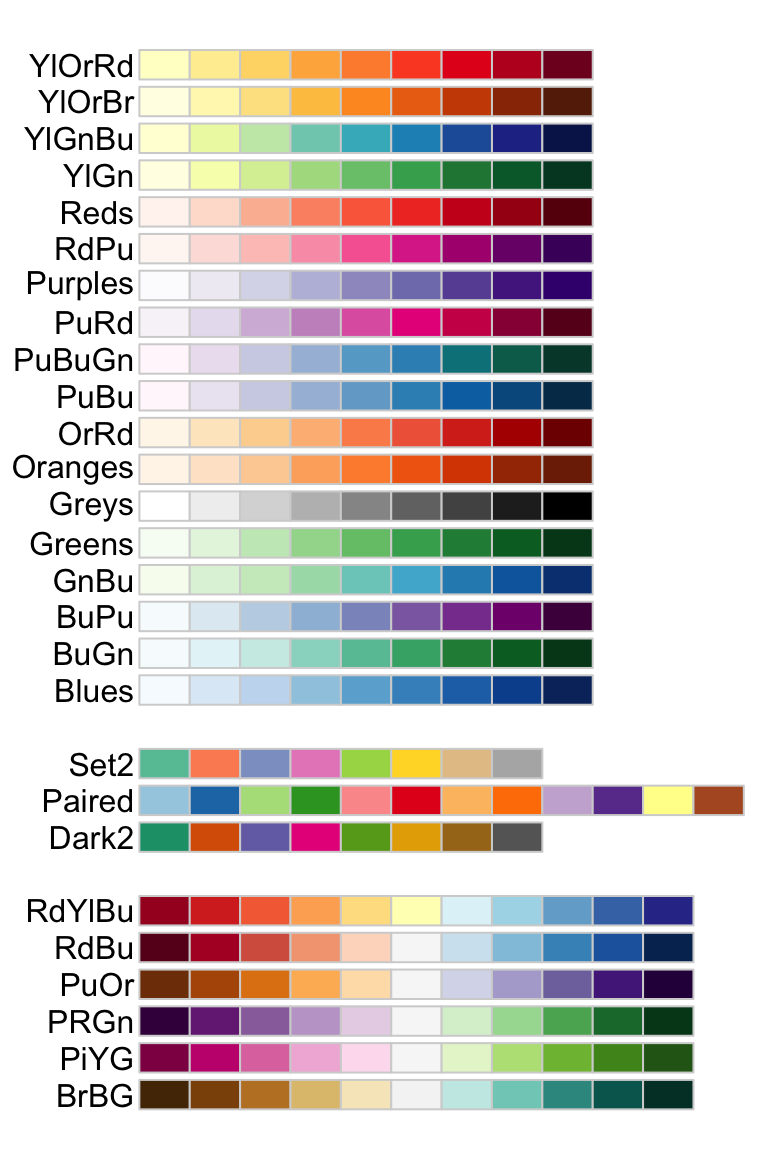
Visualize a specific brewer palette
To show a specific R color brewer palette, you can use the functions below:
# 1. Visualize a single RColorBrewer palette
# by specifying its name
display.brewer.pal(n, name)

# 2. Return the hexadecimal color code of the palette
brewer.pal(n, name)
Description of the function arguments:
n: Number of different colors in the palette, minimum 3, maximum depending on palette.name: A palette name from the lists above. For examplename = RdBu.
The following R code demonstrates how to display one single r color brewer palette.
# View a single RColorBrewer palette by specifying its name
display.brewer.pal(n = 8, name = 'Dark2')
# Hexadecimal color specification
brewer.pal(n = 8, name = "Dark2")
## [1] "#1B9E77" "#D95F02" "#7570B3" "#E7298A" "#66A61E" "#E6AB02" "#A6761D"
## [8] "#666666"Using RColorBrewer palettes in ggplot2
Create a basic ggplot colored by groups
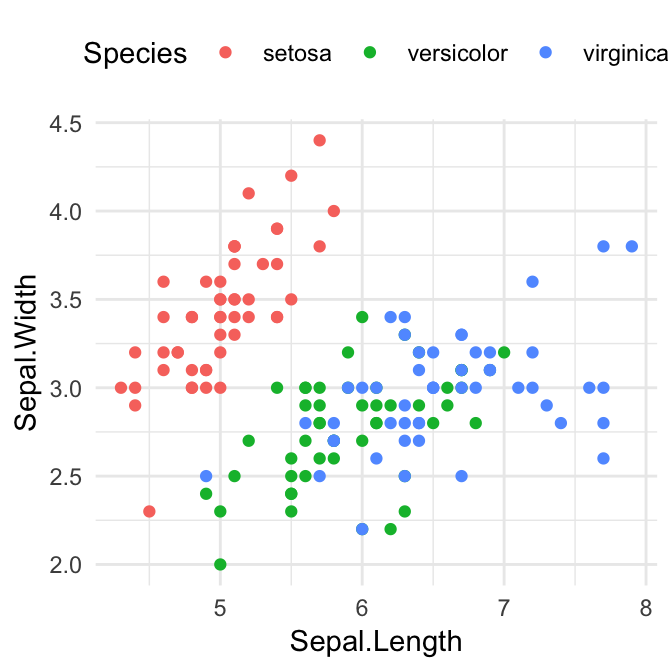
We start by creating basic ggplots using the iris demo dataset. We’ll create two differents of plots colored by groups: a scatter plot and a box plot.
library("ggplot2")
# Box plot: changing the fill color by Species
bp <- ggplot(iris, aes(Species, Sepal.Length)) +
geom_boxplot(aes(fill = Species)) +
theme_minimal() +
theme(legend.position = "top")
bp
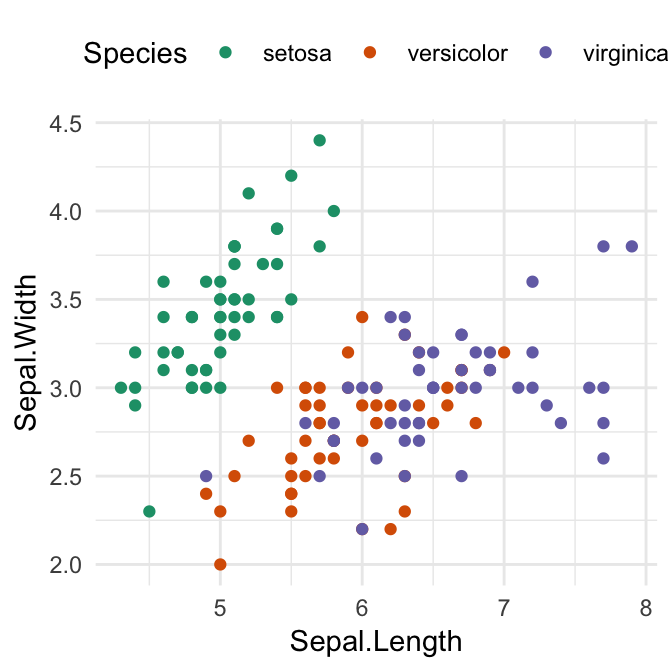
# Scatter plot: changing points color by Species
sp <- ggplot(iris, aes(Sepal.Length, Sepal.Width)) +
geom_point(aes(color = Species)) +
theme_minimal()+
theme(legend.position = "top")
sp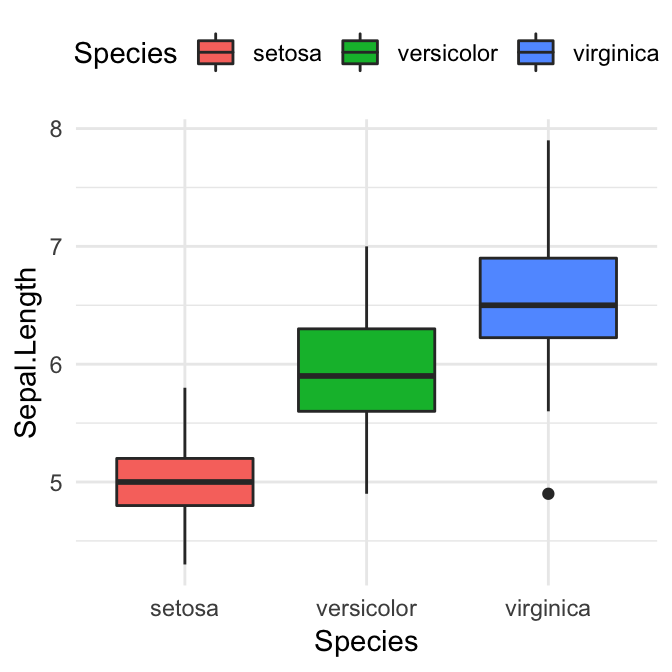
Change ggplot group colors using r color brewer palettes
Two color scale functions are available in ggplot2 for using the rcolorbrewer palettes:
scale_fill_brewer()for box plot, bar plot, violin plot, dot plot, etcscale_color_brewer()for lines and points
# Box plot
bp + scale_fill_brewer(palette = "Dark2")

# Scatter plot
sp + scale_color_brewer(palette = "Dark2")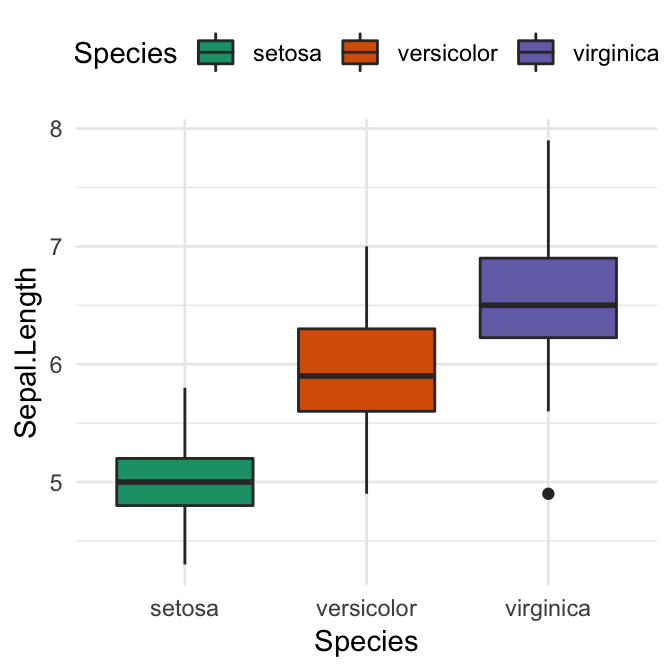
Using RColorBrewer palettes in base plots
The function brewer.pal() is used to generate a vector of colors.
# Barplot using RColorBrewer
barplot(c(2,5,7), col = brewer.pal(n = 3, name = "RdBu"))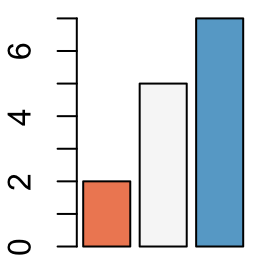
Conclusion
In this article, we describe the different color palettes available in the RColorBrewer packages. We also provide examples of R codes for changing the color of plots created by either the ggplot2 R package or the R base graphic functions.
Recommended for you
This section contains best data science and self-development resources to help you on your path.
Books - Data Science
Our Books
- Practical Guide to Cluster Analysis in R by A. Kassambara (Datanovia)
- Practical Guide To Principal Component Methods in R by A. Kassambara (Datanovia)
- Machine Learning Essentials: Practical Guide in R by A. Kassambara (Datanovia)
- R Graphics Essentials for Great Data Visualization by A. Kassambara (Datanovia)
- GGPlot2 Essentials for Great Data Visualization in R by A. Kassambara (Datanovia)
- Network Analysis and Visualization in R by A. Kassambara (Datanovia)
- Practical Statistics in R for Comparing Groups: Numerical Variables by A. Kassambara (Datanovia)
- Inter-Rater Reliability Essentials: Practical Guide in R by A. Kassambara (Datanovia)
Others
- R for Data Science: Import, Tidy, Transform, Visualize, and Model Data by Hadley Wickham & Garrett Grolemund
- Hands-On Machine Learning with Scikit-Learn, Keras, and TensorFlow: Concepts, Tools, and Techniques to Build Intelligent Systems by Aurelien Géron
- Practical Statistics for Data Scientists: 50 Essential Concepts by Peter Bruce & Andrew Bruce
- Hands-On Programming with R: Write Your Own Functions And Simulations by Garrett Grolemund & Hadley Wickham
- An Introduction to Statistical Learning: with Applications in R by Gareth James et al.
- Deep Learning with R by François Chollet & J.J. Allaire
- Deep Learning with Python by François Chollet
Version:
 Français


No Comments