# Load required R packages
suppressPackageStartupMessages(library(ggpubr))
suppressPackageStartupMessages(library(dplyr))
# Example of data from statistical tests
stat.test <- tibble::tribble(
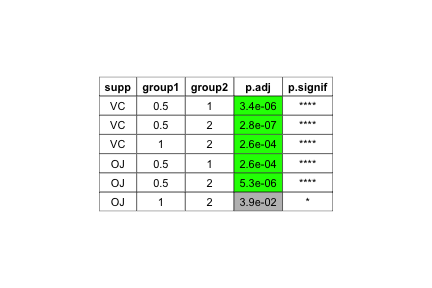
~supp, ~group1, ~group2, ~p.adj, ~p.signif,
"VC", "0.5", "1", 3.4e-06, "****",
"VC", "0.5", "2", 2.8e-07, "****",
"VC", "1", "2", 0.00026, "****",
"OJ", "0.5", "1", 0.00026, "****",
"OJ", "0.5", "2", 5.3e-06, "****",
"OJ", "1", "2", 0.039, "*"
)
# Create a ggtextable
ggtab <- ggtexttable(stat.test, rows = NULL, theme = ttheme("classic"))
# Specify colors for significant p-values
stat.test <- stat.test %>%
mutate(
fill = ifelse(p.adj < 0.01, "green", "gray"),
color = "black"
)
stat.test ## # A tibble: 6 x 7
## supp group1 group2 p.adj p.signif fill color
## <chr> <chr> <chr> <dbl> <chr> <chr> <chr>
## 1 VC 0.5 1 0.0000034 **** green black
## 2 VC 0.5 2 0.00000028 **** green black
## 3 VC 1 2 0.000260 **** green black
## 4 OJ 0.5 1 0.000260 **** green black
## 5 OJ 0.5 2 0.0000053 **** green black
## 6 OJ 1 2 0.039 * gray black# Coloring the table conditionnally using `ggpubr::table_cell_bg()`
for(i in 1:nrow(stat.test)){
row = i+1
column = which(colnames(stat.test) == "p.adj")
ggtab <- table_cell_bg(
ggtab, row = row, column = column,
fill = stat.test$fill[i], color = stat.test$color[i]
)
}
print( ggtab)
# Read more: https://rpkgs.datanovia.com/ggpubr/reference/ggtexttable.htmlRecommended for you
This section contains best data science and self-development resources to help you on your path.
Books - Data Science
Our Books
- Practical Guide to Cluster Analysis in R by A. Kassambara (Datanovia)
- Practical Guide To Principal Component Methods in R by A. Kassambara (Datanovia)
- Machine Learning Essentials: Practical Guide in R by A. Kassambara (Datanovia)
- R Graphics Essentials for Great Data Visualization by A. Kassambara (Datanovia)
- GGPlot2 Essentials for Great Data Visualization in R by A. Kassambara (Datanovia)
- Network Analysis and Visualization in R by A. Kassambara (Datanovia)
- Practical Statistics in R for Comparing Groups: Numerical Variables by A. Kassambara (Datanovia)
- Inter-Rater Reliability Essentials: Practical Guide in R by A. Kassambara (Datanovia)
Others
- R for Data Science: Import, Tidy, Transform, Visualize, and Model Data by Hadley Wickham & Garrett Grolemund
- Hands-On Machine Learning with Scikit-Learn, Keras, and TensorFlow: Concepts, Tools, and Techniques to Build Intelligent Systems by Aurelien Géron
- Practical Statistics for Data Scientists: 50 Essential Concepts by Peter Bruce & Andrew Bruce
- Hands-On Programming with R: Write Your Own Functions And Simulations by Garrett Grolemund & Hadley Wickham
- An Introduction to Statistical Learning: with Applications in R by Gareth James et al.
- Deep Learning with R by François Chollet & J.J. Allaire
- Deep Learning with Python by François Chollet
Version:
 Français


No Comments