This tutorial describes how to generate color palettes in R. Color is crucial for elegant data visualization. You will learn the basics for using the power of color and, we describe an R package and an online tool for generating beautiful color schemes.
Contents:
Understanding color wheel
The color wheel helps you visualize the relationships that colors have to one another. The wheel uses three primary colors, red, yellow and blue, spaced evenly apart. Blending those colors creates the full color wheel.
The wheel is divided into pie slices which has the following components:
hue(true color): On the wheel below, the hue is four rings out of the center.tints: correspond to the colors toward the center of the wheel (= hue + white color)shades: corresponds to the ring of colors on the outside of the hue ( = hue + black color)
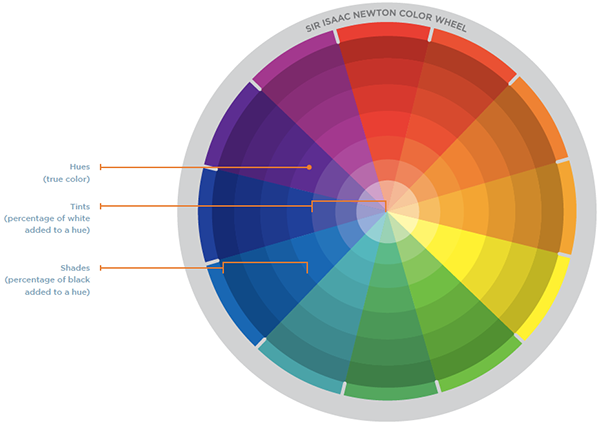
You can select colors for your palette anywhere in the wheel with any saturation of color, but make sure that it contrasts and projects well. There is a bit of a science to creating a pleasing palette (Duarte 2008).
Use the power of color
Here, we defined the basics that can help you to design great color palettes. We’ll use the R package colortools for displaying the different variations of colors.
- Monochromatic: Variations of the same color.
- Analogous: colors that are touching in the wheel creates narrow harmonious color scheme.
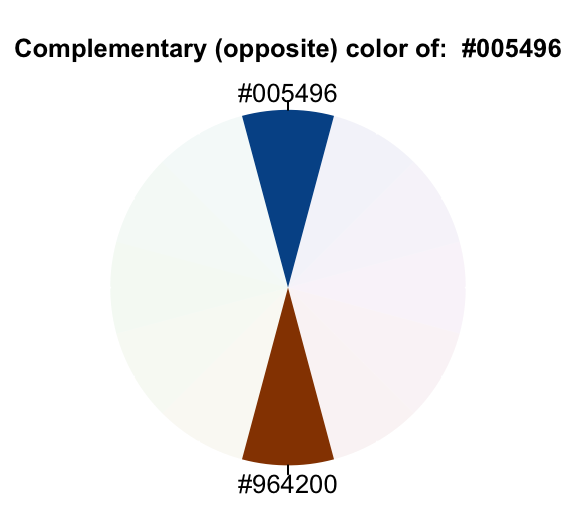
- Complementary: Colors from the opposite ends of the wheel provide the most contrast.
library(colortools)
analogous("#00AF71")

complementary("#005496")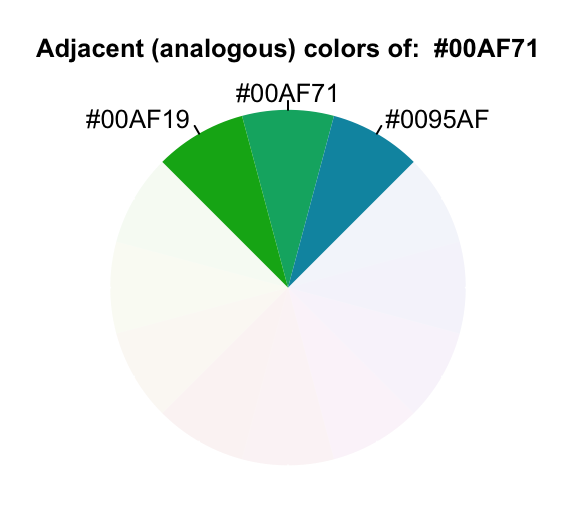
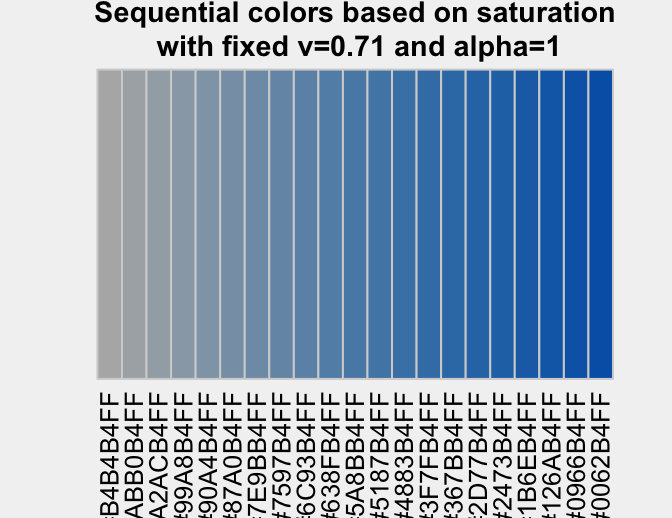
To create a variation of the same color, you can use the function sequential(). It’s also possible to generate a color wheel for a given color by using the function wheel().
# Color wheel
wheel("steelblue", num = 12)

# Sequential colors
sequential("steelblue")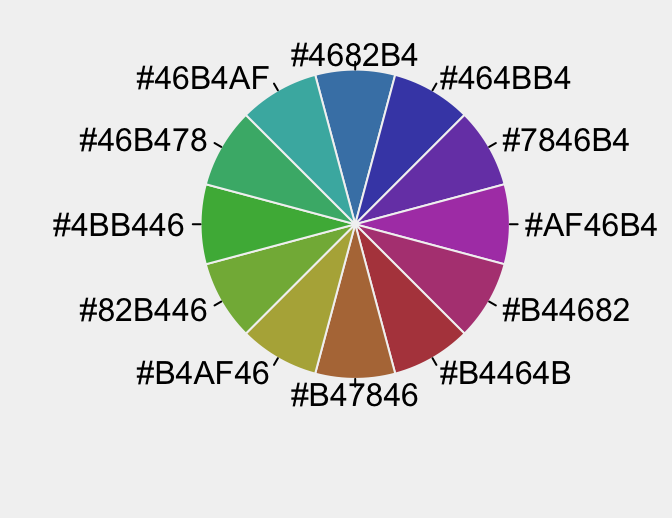
- Split Complementary: A variation of the complementary scheme that uses two colors on either side of a directly complementary color. These colors have high visual contrast but with less visual tension than purely complementary colors.
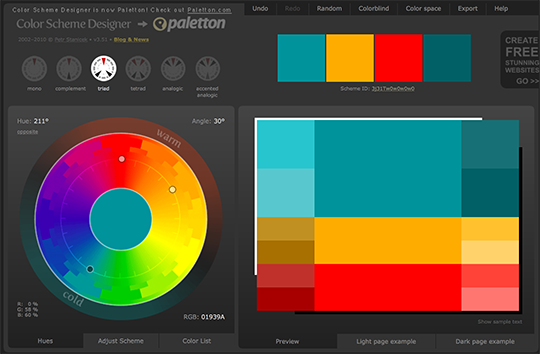
- Triadic: Three colors equally spaced around the color wheel create vivid visual interest.
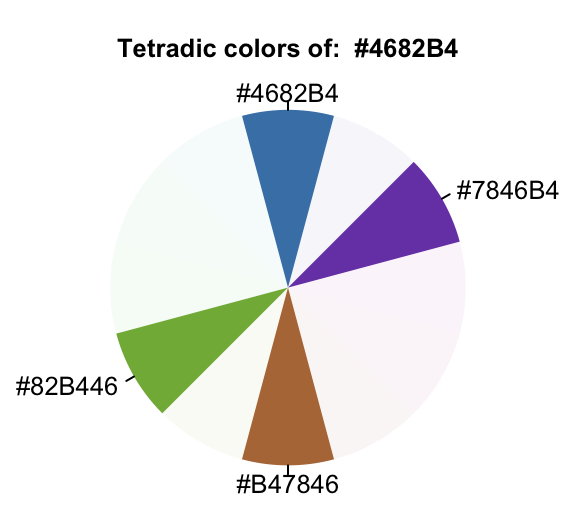
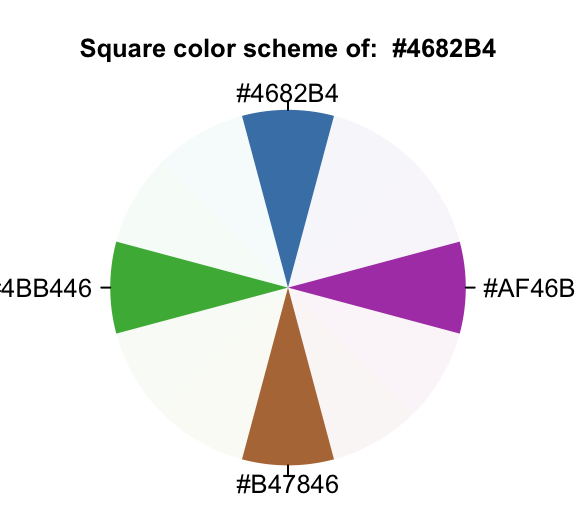
- Tetradic or Square color scheme: Two pairs of complementary colors. This scheme is popular because it offers strong visual contrast while retaining harmony.
library(colortools)
splitComp("steelblue")

tetradic("steelblue")

square("steelblue")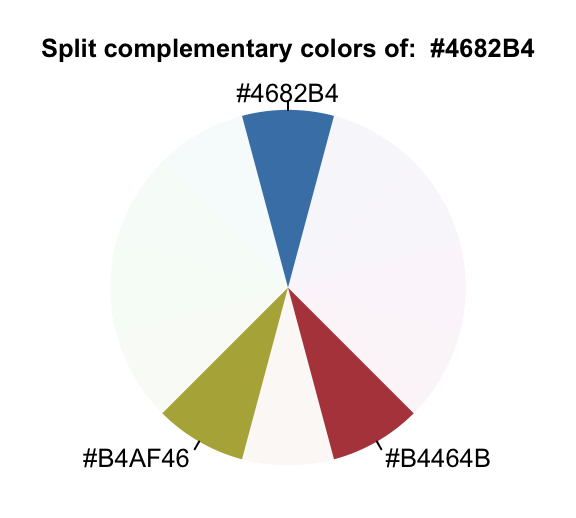
Conclusion
This article presents color wheel and provides the basics for designing your own color palettes in R.
References
Duarte, Nancy. 2008. Slide:ology the Art and Science of Creating Great Presentations. Sebastopol, CA: O’Reilly Media. http://www.worldcat.org/search?qt=worldcat_org_all&q=0596522347.
Recommended for you
This section contains best data science and self-development resources to help you on your path.
Coursera - Online Courses and Specialization
Data science
- Course: Machine Learning: Master the Fundamentals by Stanford
- Specialization: Data Science by Johns Hopkins University
- Specialization: Python for Everybody by University of Michigan
- Courses: Build Skills for a Top Job in any Industry by Coursera
- Specialization: Master Machine Learning Fundamentals by University of Washington
- Specialization: Statistics with R by Duke University
- Specialization: Software Development in R by Johns Hopkins University
- Specialization: Genomic Data Science by Johns Hopkins University
Popular Courses Launched in 2020
- Google IT Automation with Python by Google
- AI for Medicine by deeplearning.ai
- Epidemiology in Public Health Practice by Johns Hopkins University
- AWS Fundamentals by Amazon Web Services
Trending Courses
- The Science of Well-Being by Yale University
- Google IT Support Professional by Google
- Python for Everybody by University of Michigan
- IBM Data Science Professional Certificate by IBM
- Business Foundations by University of Pennsylvania
- Introduction to Psychology by Yale University
- Excel Skills for Business by Macquarie University
- Psychological First Aid by Johns Hopkins University
- Graphic Design by Cal Arts
Amazon FBA
Amazing Selling Machine
Books - Data Science
Our Books
- Practical Guide to Cluster Analysis in R by A. Kassambara (Datanovia)
- Practical Guide To Principal Component Methods in R by A. Kassambara (Datanovia)
- Machine Learning Essentials: Practical Guide in R by A. Kassambara (Datanovia)
- R Graphics Essentials for Great Data Visualization by A. Kassambara (Datanovia)
- GGPlot2 Essentials for Great Data Visualization in R by A. Kassambara (Datanovia)
- Network Analysis and Visualization in R by A. Kassambara (Datanovia)
- Practical Statistics in R for Comparing Groups: Numerical Variables by A. Kassambara (Datanovia)
- Inter-Rater Reliability Essentials: Practical Guide in R by A. Kassambara (Datanovia)
Others
- R for Data Science: Import, Tidy, Transform, Visualize, and Model Data by Hadley Wickham & Garrett Grolemund
- Hands-On Machine Learning with Scikit-Learn, Keras, and TensorFlow: Concepts, Tools, and Techniques to Build Intelligent Systems by Aurelien Géron
- Practical Statistics for Data Scientists: 50 Essential Concepts by Peter Bruce & Andrew Bruce
- Hands-On Programming with R: Write Your Own Functions And Simulations by Garrett Grolemund & Hadley Wickham
- An Introduction to Statistical Learning: with Applications in R by Gareth James et al.
- Deep Learning with R by François Chollet & J.J. Allaire
- Deep Learning with Python by François Chollet
Version:
 Français




No Comments