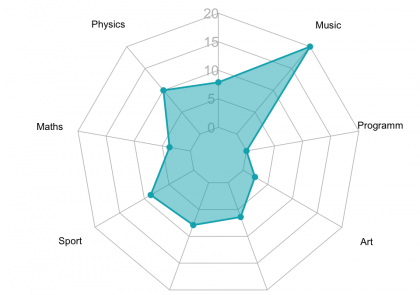
A radar chart, also known as a spider plot is used to visualize the values or scores assigned to an individual over multiple quantitative variables, where each variable corresponds to
A radar chart, also known as a spider plot is used to visualize the values or scores assigned to an individual over multiple quantitative variables, where each variable corresponds to