This article describes how to use the colorRampPalette() R function to expand color palettes. We’ll provide practical example with ggplot2.
The color scales defined in the RColorBrewer and in other packages, such as viridis, have a fixed number of colors.
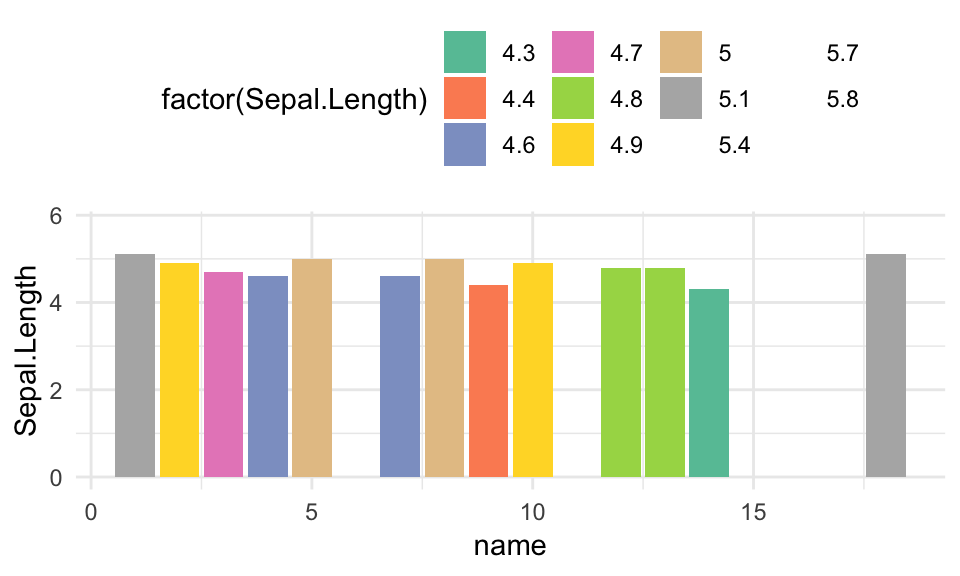
For example you have 8 colors in the Set2 brewer palette. Consequently, if your data contain more than 8 groups, ggplot2 will return a warning like this:
1: In brewer.pal(n, pal) : n too large, allowed maximum for palette Set2 is 8 Returning the palette you asked for with that many colors
For example, type this R code:
df <- iris[1:18, ]
df$name <- 1:nrow(df)

library(ggplot2)
ggplot(df) +
  geom_col(aes(name, Sepal.Length, fill = factor(Sepal.Length))) +
  scale_fill_brewer(palette="Set2") +
  theme_minimal() +
  theme(legend.position = "top")
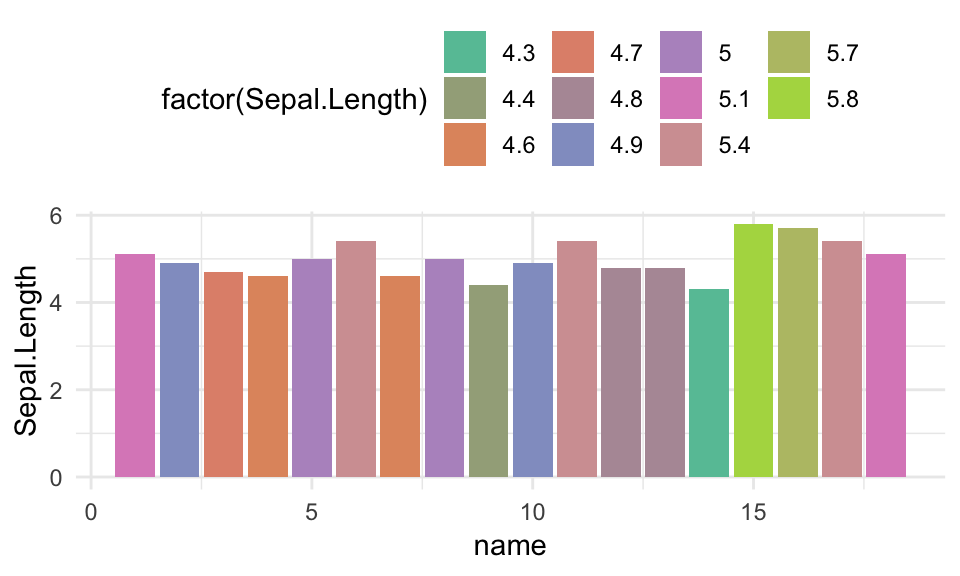
A solution is to use the function colorRampPalette() which can extend any list of colors:
library(RColorBrewer)
# Define the number of colors you want
nb.cols <- 18
mycolors <- colorRampPalette(brewer.pal(8, "Set2"))(nb.cols)
# Create a ggplot with 18 colors
# Use scale_fill_manual
ggplot(df) +
  geom_col(aes(name, Sepal.Length, fill = factor(Sepal.Length))) +
  scale_fill_manual(values = mycolors) +
  theme_minimal() +
  theme(legend.position = "top")
In conclusion, this article describes how to expand color palettes in R.
Recommended for you
This section contains best data science and self-development resources to help you on your path.
Books - Data Science
Our Books
- Practical Guide to Cluster Analysis in R by A. Kassambara (Datanovia)
- Practical Guide To Principal Component Methods in R by A. Kassambara (Datanovia)
- Machine Learning Essentials: Practical Guide in R by A. Kassambara (Datanovia)
- R Graphics Essentials for Great Data Visualization by A. Kassambara (Datanovia)
- GGPlot2 Essentials for Great Data Visualization in R by A. Kassambara (Datanovia)
- Network Analysis and Visualization in R by A. Kassambara (Datanovia)
- Practical Statistics in R for Comparing Groups: Numerical Variables by A. Kassambara (Datanovia)
- Inter-Rater Reliability Essentials: Practical Guide in R by A. Kassambara (Datanovia)
Others
- R for Data Science: Import, Tidy, Transform, Visualize, and Model Data by Hadley Wickham & Garrett Grolemund
- Hands-On Machine Learning with Scikit-Learn, Keras, and TensorFlow: Concepts, Tools, and Techniques to Build Intelligent Systems by Aurelien Géron
- Practical Statistics for Data Scientists: 50 Essential Concepts by Peter Bruce & Andrew Bruce
- Hands-On Programming with R: Write Your Own Functions And Simulations by Garrett Grolemund & Hadley Wickham
- An Introduction to Statistical Learning: with Applications in R by Gareth James et al.
- Deep Learning with R by François Chollet & J.J. Allaire
- Deep Learning with Python by François Chollet
Version:
 Français


Amazing tutorial.. saved my life keep spreading the knowledge!! God bless you!
Thank you for the positive feedback, highly appreciated!
I want to use colorRampPalette() to get 15 colour legend and gradient for a heatmap using pheatmap package. Can you help me out regarding that?
Thank you for this tip! It was really useful!!
Thank you, Thank you. I was stuck.