In this R graphics tutorial, we present a gallery of ggplot themes.
You’ll learn how to:
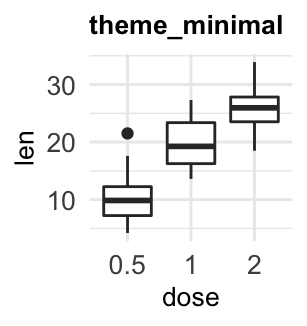
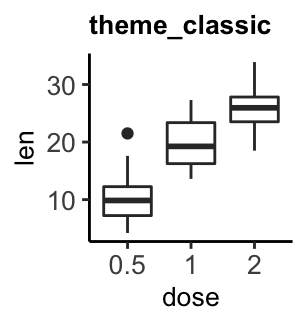
- Change the default ggplot theme by using the list of the standard themes available in ggplot2 R package. Our selection of best ggplot themes for professional publications or presentations, include: theme_classic(), theme_minimal() and theme_bw(). Another famous theme is the dark theme: theme_dark().
- Use other helpful examples of ggplot2 themes available in the ggthemes R package. These include theme_tufte(), theme_economist() and theme_hc(). You’ll also see how to create a tufte minimalist boxplot.
- Modify, at once, all the theme text elements by specifying the ggplot base_size argument in the theme functions. Example:
p + theme_minimal(base_size = 18). - Change the theme for the entire session using theme_set(). For example, is you type
theme_set(theme_classic(base_size = 16))in the R console, then the classic theme will be automatically applied to every plot you draw. The theme_set() function completely override the current active theme. - Create your own custom theme.
Contents:
Basic ggplot
Data: ToothGrowth
# Convert the column dose to factor variable
data("ToothGrowth")
ToothGrowth$dose <- as.factor(ToothGrowth$dose)

# Create a simple boxplot
library(ggplot2)
p <- ggplot(ToothGrowth, aes(x = dose, y = len)) +
  geom_boxplot()
Change themes
Use themes in ggplot2
Several simple functions are available in ggplot2 package to set easily a ggplot theme. These include:
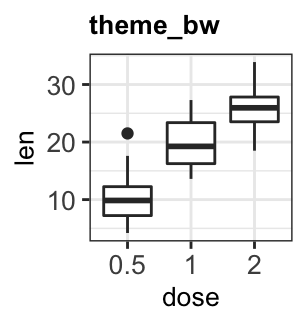
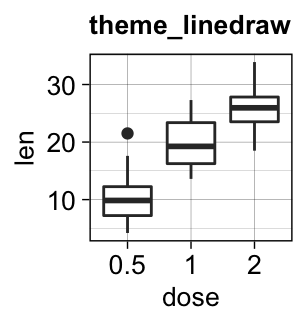
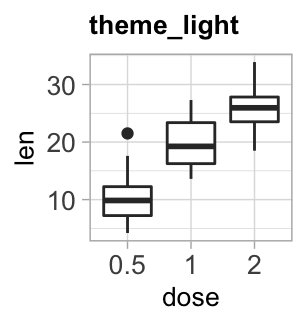
theme_gray(): Gray background color and white grid lines. Put the data forward to make comparisons easy.theme_bw(): White background and gray grid lines. May work better for presentations displayed with a projector.theme_linedraw(): A theme with black lines of various widths on white backgrounds, reminiscent of a line drawings.theme_light(): A theme similar totheme_linedraw()but with light grey lines and axes, to direct more attention towards the data.
p + theme_gray(base_size = 14)

p + theme_bw()

p + theme_linedraw()

p + theme_light()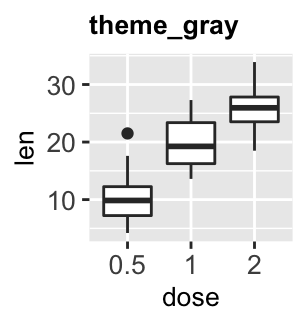
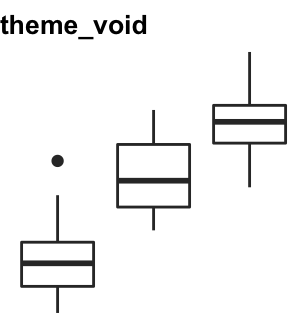
theme_dark(): Same as theme_light but with a dark background. Useful to make thin coloured lines pop out.theme_minimal(): A minimal theme with no background annotationstheme_classic(): A classic theme, with x and y axis lines and no gridlines.theme_void(): a completely empty theme, useful for plots with non-standard coordinates or for drawings.
p + theme_dark()

p + theme_minimal()

p + theme_classic()

p + theme_void()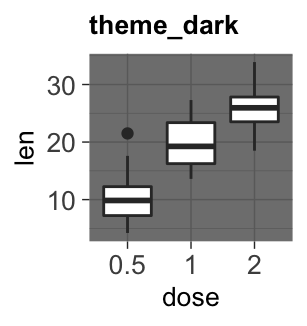
Use ggthemes
The R package ggthemes provides another gallery of custom ggplot themes, which include:
theme_tufte(): a minimalist themetheme_economist(): theme based on the plots in the economist magazinetheme_stata(): theme based on stata graph schemes.theme_hc(): theme based on Highcharts JS
To use these themes, first install and load the ggthemes package as follow :
install.packages("ggthemes") # Install

library(ggthemes) # Load
Then, create two basic ggplot: scatter plot and boxplot.
# Scatter plot
sp <- ggplot(mtcars, aes(wt, mpg)) +
  geom_point()
sp

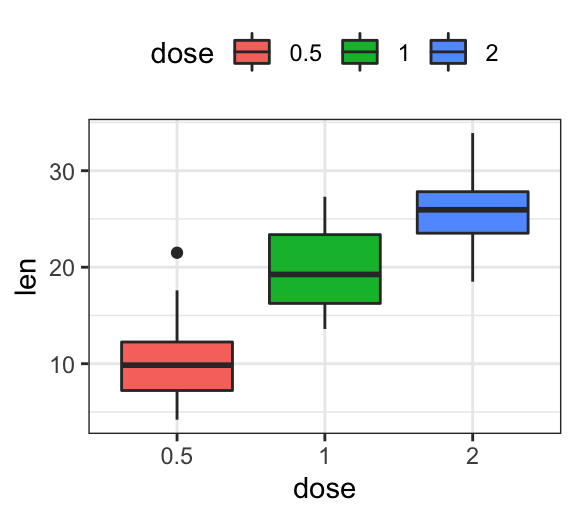
# Boxblot
ToothGrowth$dose <- as.factor(ToothGrowth$dose)
bxp <- ggplot(ToothGrowth, aes(x = dose, y = len)) +
  geom_boxplot(aes(fill = dose))
bxp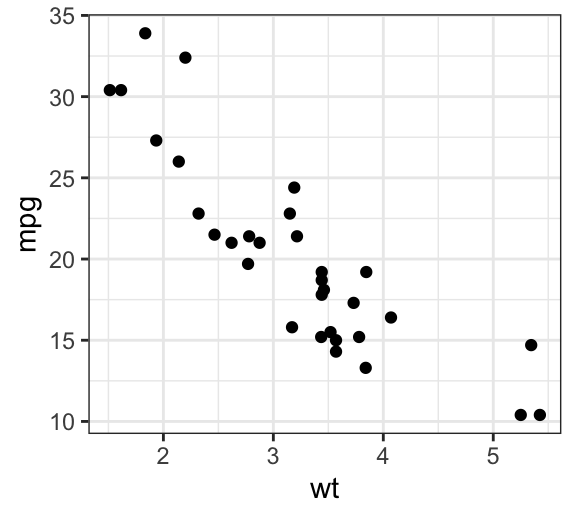
theme_tufte
Key R functions:
- theme_tufte(): set tufte theme
- geom_tufteboxplot(): Create tufte boxplot
- geom_rangeframe(): Extend axis lines to the maximum and the minimum of the plot data
Create a scatter plot with tufte theme:
library(ggthemes)
sp + geom_rangeframe() +  theme_tufte()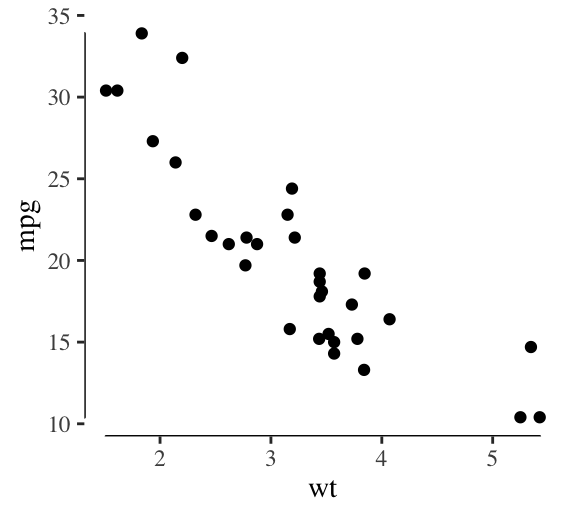
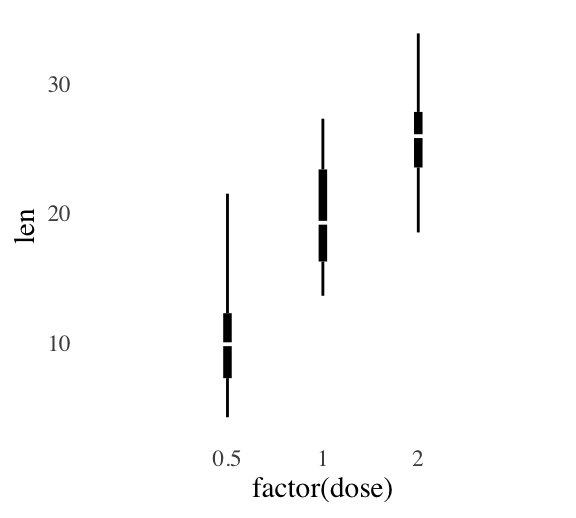
Create a tufte boxplot. The function `geom_tufteboxplot() creates several variants of Tufte’s minimal-ink boxplots. The following R code, will create two types of boxplots.
- Boxplot 1:
- a point indicates the median,
- a gap indicates the interquartile range,
- and lines the whiskers
- Boxplot 2:
- a wide line indicates interquartile range,
- a gap indicates the median,
- and lines indicate the minimum and maximum
p <- ggplot(ToothGrowth, aes(factor(dose), len)) +
  theme_tufte(ticks = FALSE)

# Box plot 1
p + geom_tufteboxplot()

# Box plot 2
p + geom_tufteboxplot(median.type = "line",
                      whisker.type = 'line',
                      hoffset = 0, width = 3)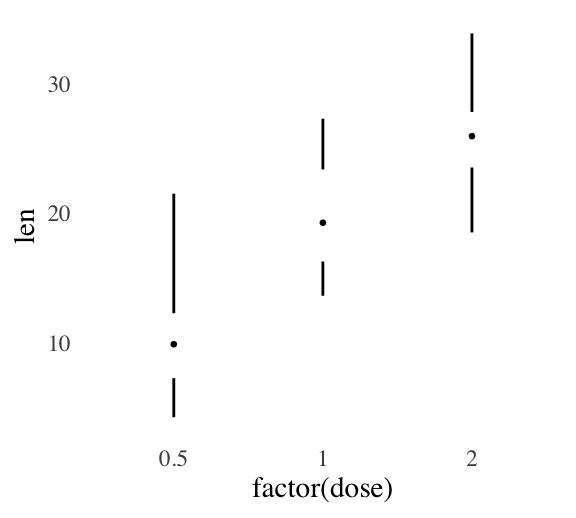
theme_economist
Key R functions:
- theme_economist()
- scale_fill_economist()
- scale_color_economist()
Create a boxplot with the economist theme:
bxp + theme_economist() + scale_fill_economist()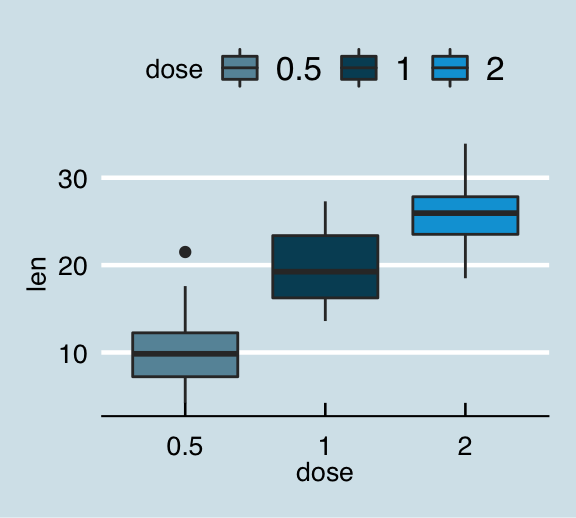
theme_stata
Key R functions:
- theme_stata()
- scale_fill_stata()
- scale_color_stata()
bxp + theme_stata() + scale_fill_stata()theme_hc
bxp + theme_hc()+ scale_colour_hc()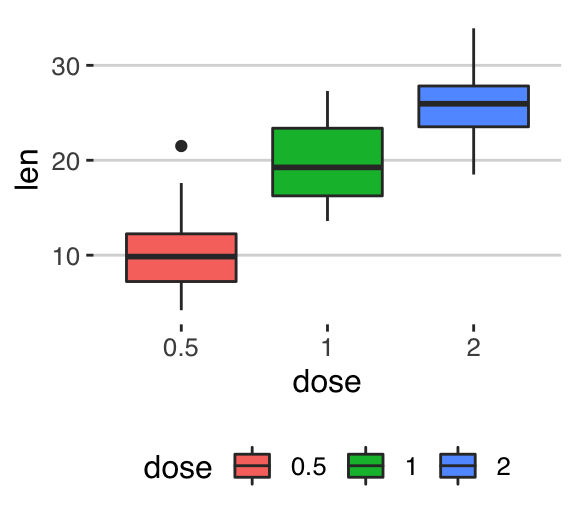
Override the current theme: theme_set
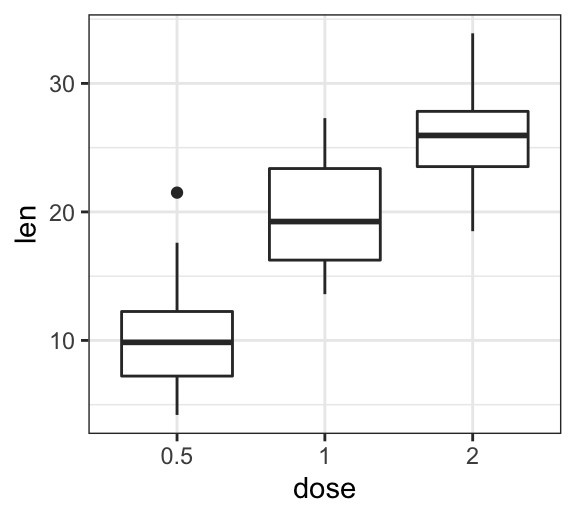
The function theme_set() can be used to change the theme for the entire session. It returns the old theme, so that we can restore it later.
p <- ggplot(ToothGrowth, aes(x = dose, y = len)) +
  geom_boxplot()
# Set theme_bw()
old.theme <- theme_set(theme_bw())
p

# Restore the old theme
theme_set(old.theme)
p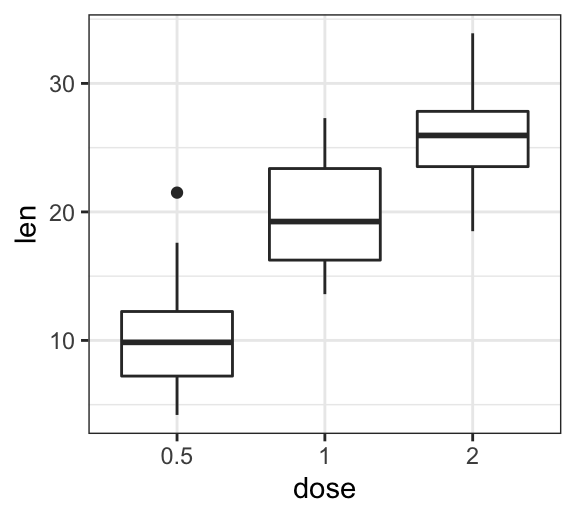
Change ggplot theme base_size and base_family
Note that, the theme functions can take the two arguments below :
- base_size: base font size (to change the size of all plot text elements)
- base_family: base font family
For example, the size of all the plot text elements can be easily changed at once, using:
p + theme_gray(base_size = 18, base_family = "Times")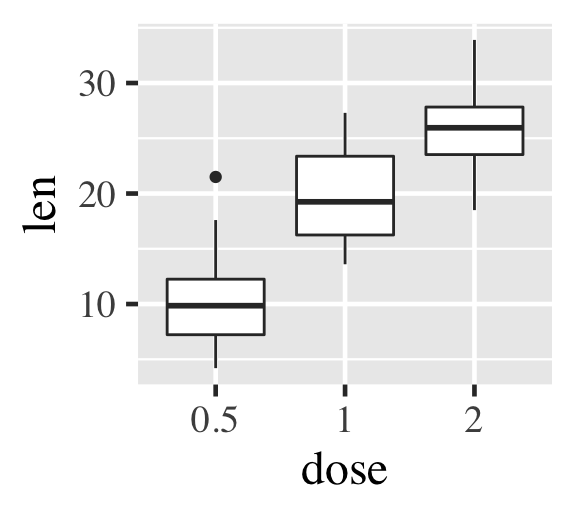
Create a custom theme
The function theme() is used to control non-data parts of a ggplot2 graph, including
- Line elements: axis lines, minor and major grid lines, plot panel border, axis ticks background color, etc.
- Text elements: plot title, axis titles, legend title and text, axis tick mark labels, etc.
- Rectangle elements: plot background, panel background, legend background, etc.
There is a specific function to modify each of these three elements :
element_line(color, size, linetype)to modify the line elements of the themeelement_text(face, color, size, hjust, vjust, angle)to modify the text elementselement_rect(fill, color, size, linetype)to modify the rectangle elements
Note that, each of the theme elements can be removed using the function element_blank().
The easiest way to create a custom theme is, for example, to extract and modify the R code of the function theme_gray() or any other theme functions [theme_bw(), theme_classic(), etc].
- Build your theme from scrach by starting with the source code of the function
theme_gray():
theme_gray

function (base_size = 11, base_family = "") {

 half_line <- base_size/2

theme(
  ...
  axis.text = element_text(size = rel(0.8), colour = "grey30"),
  ...
  )

}- Create a new theme called
theme_bluewhite()by starting with the source code of the functiontheme_bw(). We’ll replace only some theme elements.
# Create a new theme
theme_bluewhite <- function (base_size = 11, base_family = "") {
    theme_bw() %+replace%
    theme(
      panel.grid.major  = element_line(color = "white"),
      panel.background = element_rect(fill = "lightblue"),
      panel.border = element_rect(color = "lightblue", fill = NA),
      axis.line = element_line(color = "lightblue"),
      axis.ticks = element_line(color = "lightblue"),
      axis.text = element_text(color = "steelblue")
      )
}

# Using our new theme
ggplot(ToothGrowth, aes(dose, len)) +
  geom_boxplot() +
  theme_bluewhite()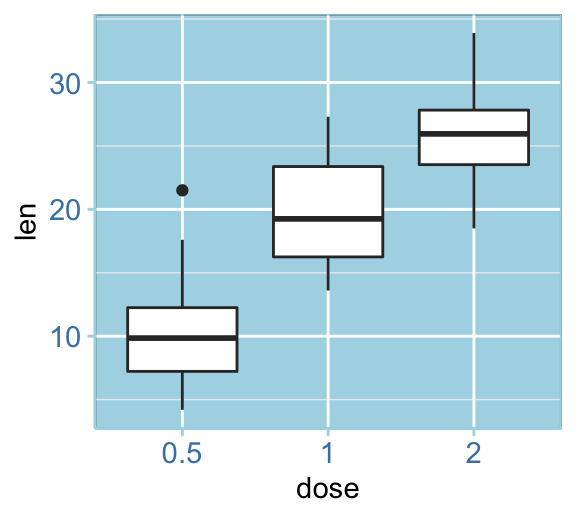
Conclusion
We present a list of ggplot themes to easily customize your graphs. We also describe how to create a custom ggplot theme.
The main points as shown below.
- Create an example of ggplot:
library(ggplot2)
p <- ggplot(ToothGrowth, aes(x = dose, y = len)) +
geom_boxplot()- Change ggplot the background theme by using one of the following professional themes:
- theme_bw(), theme_minimal(), theme_classic() and theme_dark() [in ggplot2 package]
- theme_tufte() and theme_economist() [in ggthemes]
p + theme_minimal()Recommended for you
This section contains best data science and self-development resources to help you on your path.
Books - Data Science
Our Books
- Practical Guide to Cluster Analysis in R by A. Kassambara (Datanovia)
- Practical Guide To Principal Component Methods in R by A. Kassambara (Datanovia)
- Machine Learning Essentials: Practical Guide in R by A. Kassambara (Datanovia)
- R Graphics Essentials for Great Data Visualization by A. Kassambara (Datanovia)
- GGPlot2 Essentials for Great Data Visualization in R by A. Kassambara (Datanovia)
- Network Analysis and Visualization in R by A. Kassambara (Datanovia)
- Practical Statistics in R for Comparing Groups: Numerical Variables by A. Kassambara (Datanovia)
- Inter-Rater Reliability Essentials: Practical Guide in R by A. Kassambara (Datanovia)
Others
- R for Data Science: Import, Tidy, Transform, Visualize, and Model Data by Hadley Wickham & Garrett Grolemund
- Hands-On Machine Learning with Scikit-Learn, Keras, and TensorFlow: Concepts, Tools, and Techniques to Build Intelligent Systems by Aurelien Géron
- Practical Statistics for Data Scientists: 50 Essential Concepts by Peter Bruce & Andrew Bruce
- Hands-On Programming with R: Write Your Own Functions And Simulations by Garrett Grolemund & Hadley Wickham
- An Introduction to Statistical Learning: with Applications in R by Gareth James et al.
- Deep Learning with R by François Chollet & J.J. Allaire
- Deep Learning with Python by François Chollet
Version:
 Français


very interesting post! keep the great work!
Thank you for the positive feedback!
Love your bluewhite theme. Great job.