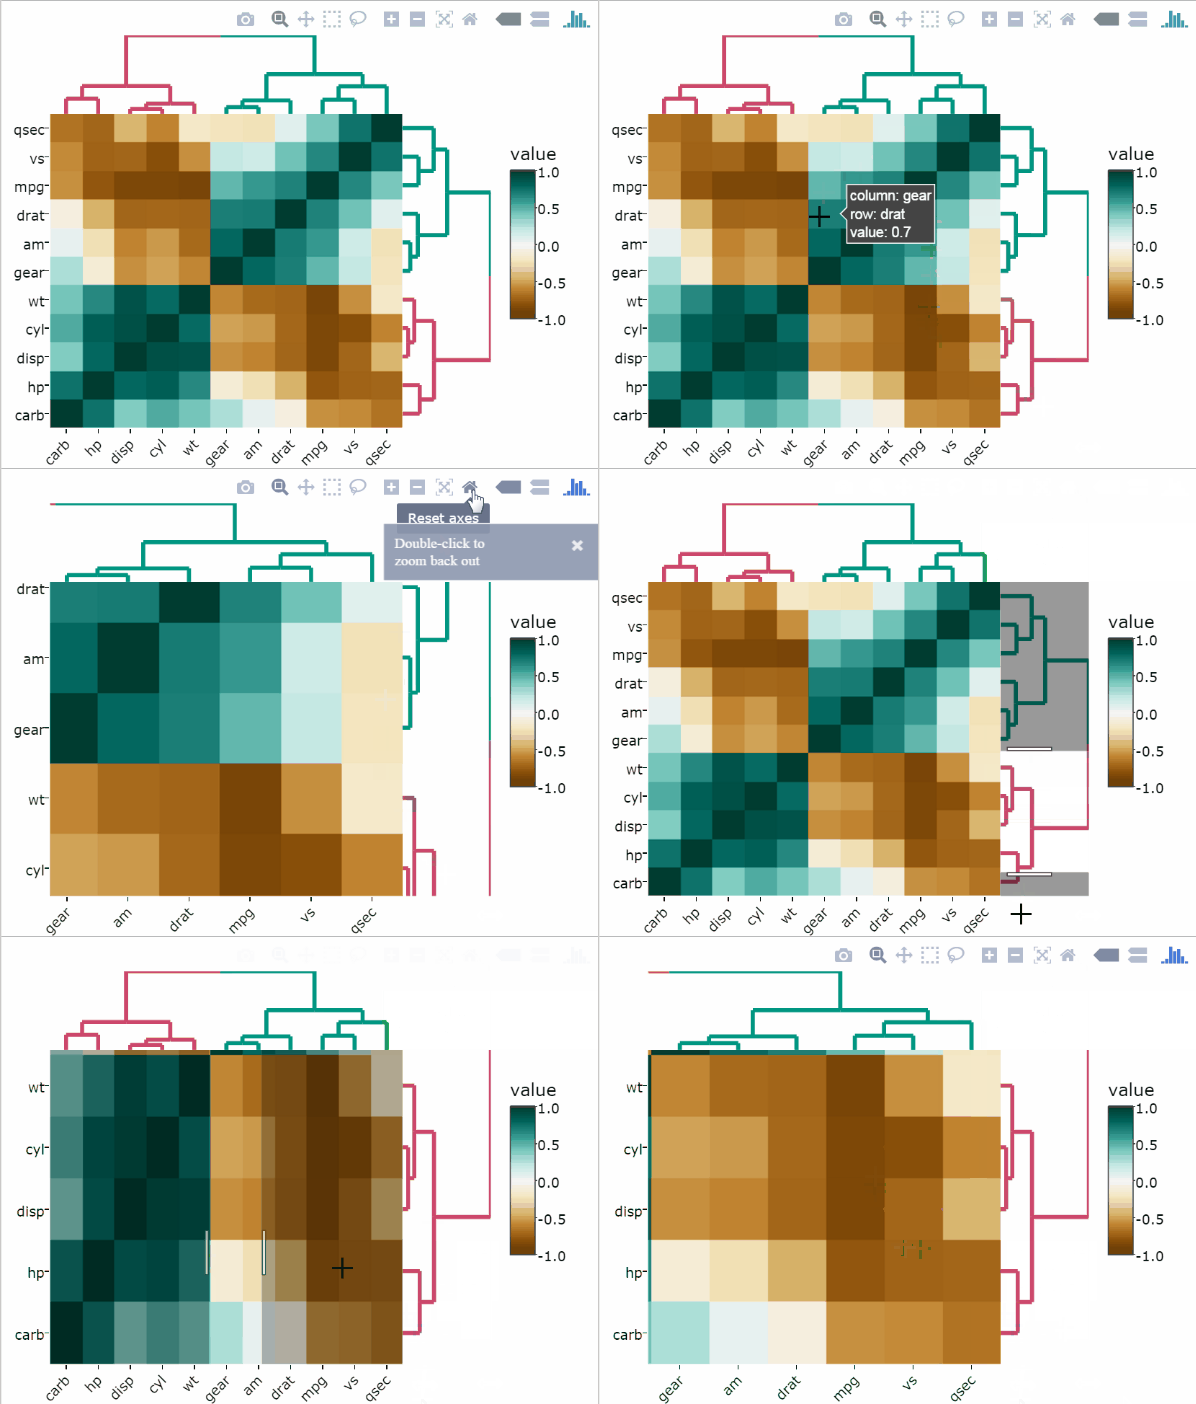
This articles describes how to create an interactive correlation matrix heatmap in R. You will learn two different approaches:
- Using the heatmaply R package
- Using the combination of the
ggcorrplotand theplotlyR packages.

Contents:
Prerequisites
Install required R packages:
install.packages("plotly")
install.packages("heatmaply")
install.packages("ggcorrplot")
Data preparation
df <- mtcarsCorrelation heatmaps using heatmaply
Load R packages
library(heatmaply)Basic correlation matrix heatmap
Use the arguments k_col and k_row to specify the desired number of groups by which to color the dendrogram’s branches in the columns and rows, respectively.
heatmaply_cor(
  cor(df),
  xlab = "Features",
  ylab = "Features",
  k_col = 2,
  k_row = 2
)Change the point size according to the correlation test p-values
# Compute correlation coefficients
cor.coef <- cor(df)

# Compute correlation p-values
cor.test.p <- function(x){
    FUN <- function(x, y) cor.test(x, y)[["p.value"]]
    z <- outer(
      colnames(x),
      colnames(x),
      Vectorize(function(i,j) FUN(x[,i], x[,j]))
    )
    dimnames(z) <- list(colnames(x), colnames(x))
    z
}
p <- cor.test.p(df)
# Create the heatmap
heatmaply_cor(
cor.coef,
node_type = "scatter",
point_size_mat = -log10(p),
point_size_name = "-log10(p-value)",
label_names = c("x", "y", "Correlation")
)Correlation heatmaps using ggcorrplot
Load R packages
library(ggcorrplot)Static heatmap of the correlation matrix
# Compute a correlation matrix
corr <- round(cor(df), 1)

# Compute a matrix of correlation p-values
p.mat <- cor_pmat(df)

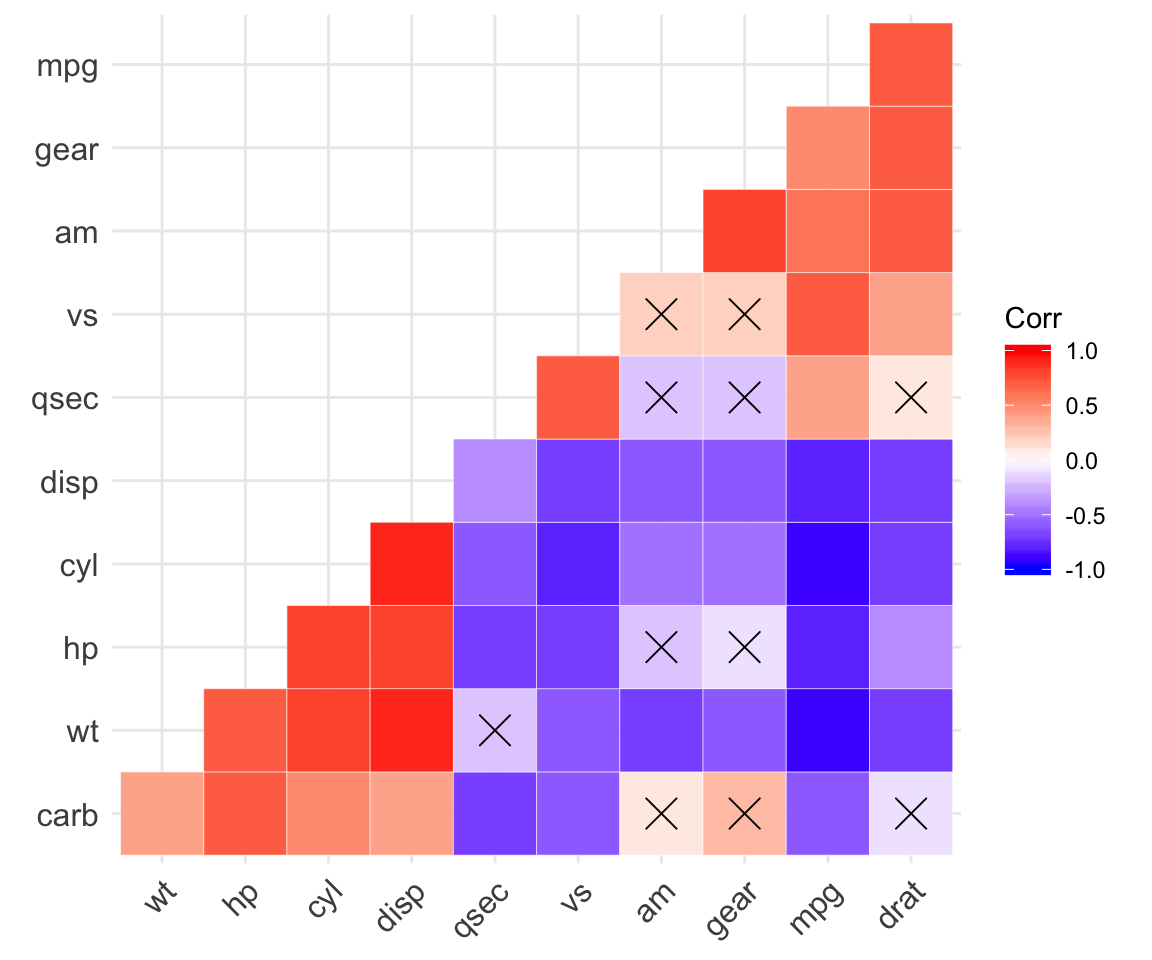
# Visualize the lower triangle of the correlation matrix
# Barring the no significant coefficient
corr.plot <- ggcorrplot(
  corr, hc.order = TRUE, type = "lower", outline.col = "white",
  p.mat = p.mat
  )
corr.plot
Make the correlation heatmap interactive
library(plotly)
ggplotly(corr.plot)`
Recommended for you
This section contains best data science and self-development resources to help you on your path.
Books - Data Science
Our Books
- Practical Guide to Cluster Analysis in R by A. Kassambara (Datanovia)
- Practical Guide To Principal Component Methods in R by A. Kassambara (Datanovia)
- Machine Learning Essentials: Practical Guide in R by A. Kassambara (Datanovia)
- R Graphics Essentials for Great Data Visualization by A. Kassambara (Datanovia)
- GGPlot2 Essentials for Great Data Visualization in R by A. Kassambara (Datanovia)
- Network Analysis and Visualization in R by A. Kassambara (Datanovia)
- Practical Statistics in R for Comparing Groups: Numerical Variables by A. Kassambara (Datanovia)
- Inter-Rater Reliability Essentials: Practical Guide in R by A. Kassambara (Datanovia)
Others
- R for Data Science: Import, Tidy, Transform, Visualize, and Model Data by Hadley Wickham & Garrett Grolemund
- Hands-On Machine Learning with Scikit-Learn, Keras, and TensorFlow: Concepts, Tools, and Techniques to Build Intelligent Systems by Aurelien Géron
- Practical Statistics for Data Scientists: 50 Essential Concepts by Peter Bruce & Andrew Bruce
- Hands-On Programming with R: Write Your Own Functions And Simulations by Garrett Grolemund & Hadley Wickham
- An Introduction to Statistical Learning: with Applications in R by Gareth James et al.
- Deep Learning with R by François Chollet & J.J. Allaire
- Deep Learning with Python by François Chollet
Version:
 Français


No Comments