Blog

We provide practical tutorials on data mining, visualization and statistics for decision making.

Version: Français

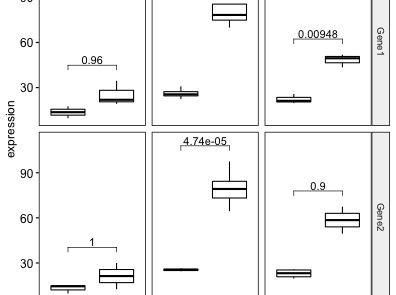
# Load required R packages library(ggpubr) library(rstatix) # Data preparation df <- tibble::tribble( ~sample_type, ~expression, ~cancer_type, ~gene, "cancer", 25.8, "Lung", "Gene1", "cancer", 25.5, "Liver", "Gene1", "cancer", 22.4, "Liver", "Gene1", "cancer",

GGPUBR: How to Add Adjusted P-values to a Multi-Panel GGPlot

# Load required R packages library(ggpubr) library(rstatix) # Data preparation df <- tibble::tribble( ~sample_type, ~expression, ~cancer_type, ~gene, "cancer", 25.8, "Lung", "Gene1", "cancer", 25.5, "Liver", "Gene1", "cancer", 22.4, "Liver", "Gene1", "cancer",

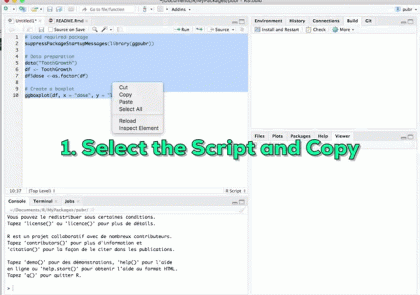
This article describes how to publish a reproducible example from R to the datanovia website using the pubr package. The goal of pubr R package is to convert reproducible R

Publish Reproducible Examples from R to Datanovia Website

This article describes how to publish a reproducible example from R to the datanovia website using the pubr package. The goal of pubr R package is to convert reproducible R

Requirements: dplyr v>=1.0.0 library(dplyr) # Data preparation df <- as_tibble(iris) df ## # A tibble: 150 x 5 ## Sepal.Length Sepal.Width Petal.Length Petal.Width Species ## <dbl> <dbl> <dbl> <dbl> <fct>

dplyr: How to Select a Character Vector of Variable Names

Requirements: dplyr v>=1.0.0 library(dplyr) # Data preparation df <- as_tibble(iris) df ## # A tibble: 150 x 5 ## Sepal.Length Sepal.Width Petal.Length Petal.Width Species ## <dbl> <dbl> <dbl> <dbl> <fct>

This article describes how to compute summary statistics, such as mean, sd, quantiles, across multiple numeric columns. Key R functions and packages The dplyr package is required. We’ll

dplyr: How to Compute Summary Statistics Across Multiple Columns

This article describes how to compute summary statistics, such as mean, sd, quantiles, across multiple numeric columns. Key R functions and packages The dplyr package is required. We’ll

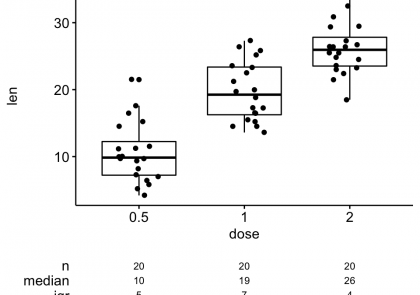
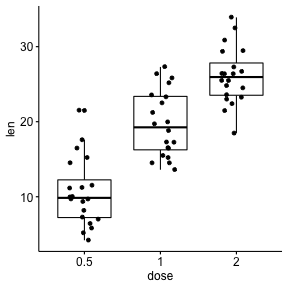
R codes are provided for creating a nice box and whisker plot in R with summary table under the plot. # Load required R packages library(ggpubr) # Data preparation df

How to Create a Nice Box and Whisker Plot in R

R codes are provided for creating a nice box and whisker plot in R with summary table under the plot. # Load required R packages library(ggpubr) # Data preparation df

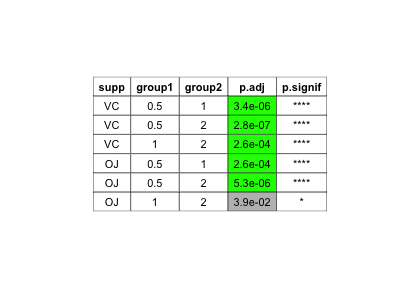
# Load required R packages suppressPackageStartupMessages(library(ggpubr)) suppressPackageStartupMessages(library(dplyr)) # Example of data from statistical tests stat.test <- tibble::tribble( ~supp, ~group1, ~group2, ~p.adj, ~p.signif, "VC", "0.5", "1", 3.4e-06, "****", "VC", "0.5", "2",

How to Draw a Textual Table with GGPLOT and Color Cells Conditionally

# Load required R packages suppressPackageStartupMessages(library(ggpubr)) suppressPackageStartupMessages(library(dplyr)) # Example of data from statistical tests stat.test <- tibble::tribble( ~supp, ~group1, ~group2, ~p.adj, ~p.signif, "VC", "0.5", "1", 3.4e-06, "****", "VC", "0.5", "2",

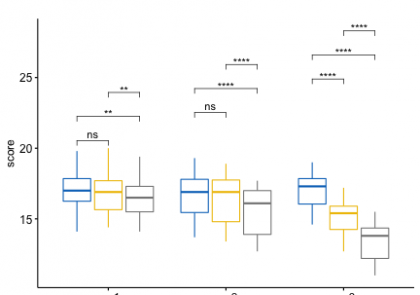
Prerequisites # Load required R packages library(tidyverse) library(rstatix) library(ggpubr) Data preparation We’ll use the anxiety dataset , which contains the anxiety score, measured at three time points

How to Perform Multiple Paired T-tests in R

Prerequisites # Load required R packages library(tidyverse) library(rstatix) library(ggpubr) Data preparation We’ll use the anxiety dataset , which contains the anxiety score, measured at three time points