This article describes how to publish a reproducible example from R to the datanovia website using the pubr package.
The goal of pubr R package is to convert reproducible R scripts and Rmd contents into a publishable HTML block. It makes it easy to share reproducible R code in (wordpress) website comments and blog posts.
You will learn many examples for publishing reproducible R scripts.
Contents:
Prerequisites
Install the pubr package:
if(require(devtools)) install.packages("devtools")
devtools::install_github("kassambara/pubr")
Load the package:
library("pubr")Note that, if you are using Rstudio on linux, make sure you have installed the following system dependencies that make it easy to interact with clipboard: xclip or xsel. This can be installed using for example apt-get install xclip in bash terminal.
Main requirements
- Include a demo data, which can be built-in data or a sample of your own data. Examples of built-in R datasets are:
ToothGrowth,PlantGrowth,mtcarsandiris - Include commands on a strict “need to run” basis
- Include the so-called “session info”:
pubr::render_r(session_info = TRUE) - Use good R coding style
Yes, creating a great reproducible example (reprex) requires work. You are asking other people to do work too. It’s a partnership.
80% of the time you will solve your own problem in the course of writing an excellent reprex.
The remaining 20% of the time, you will create a reprex that is more likely to elicit the desired behavior in others.
Example 1: Reproducible R script using R built-in data
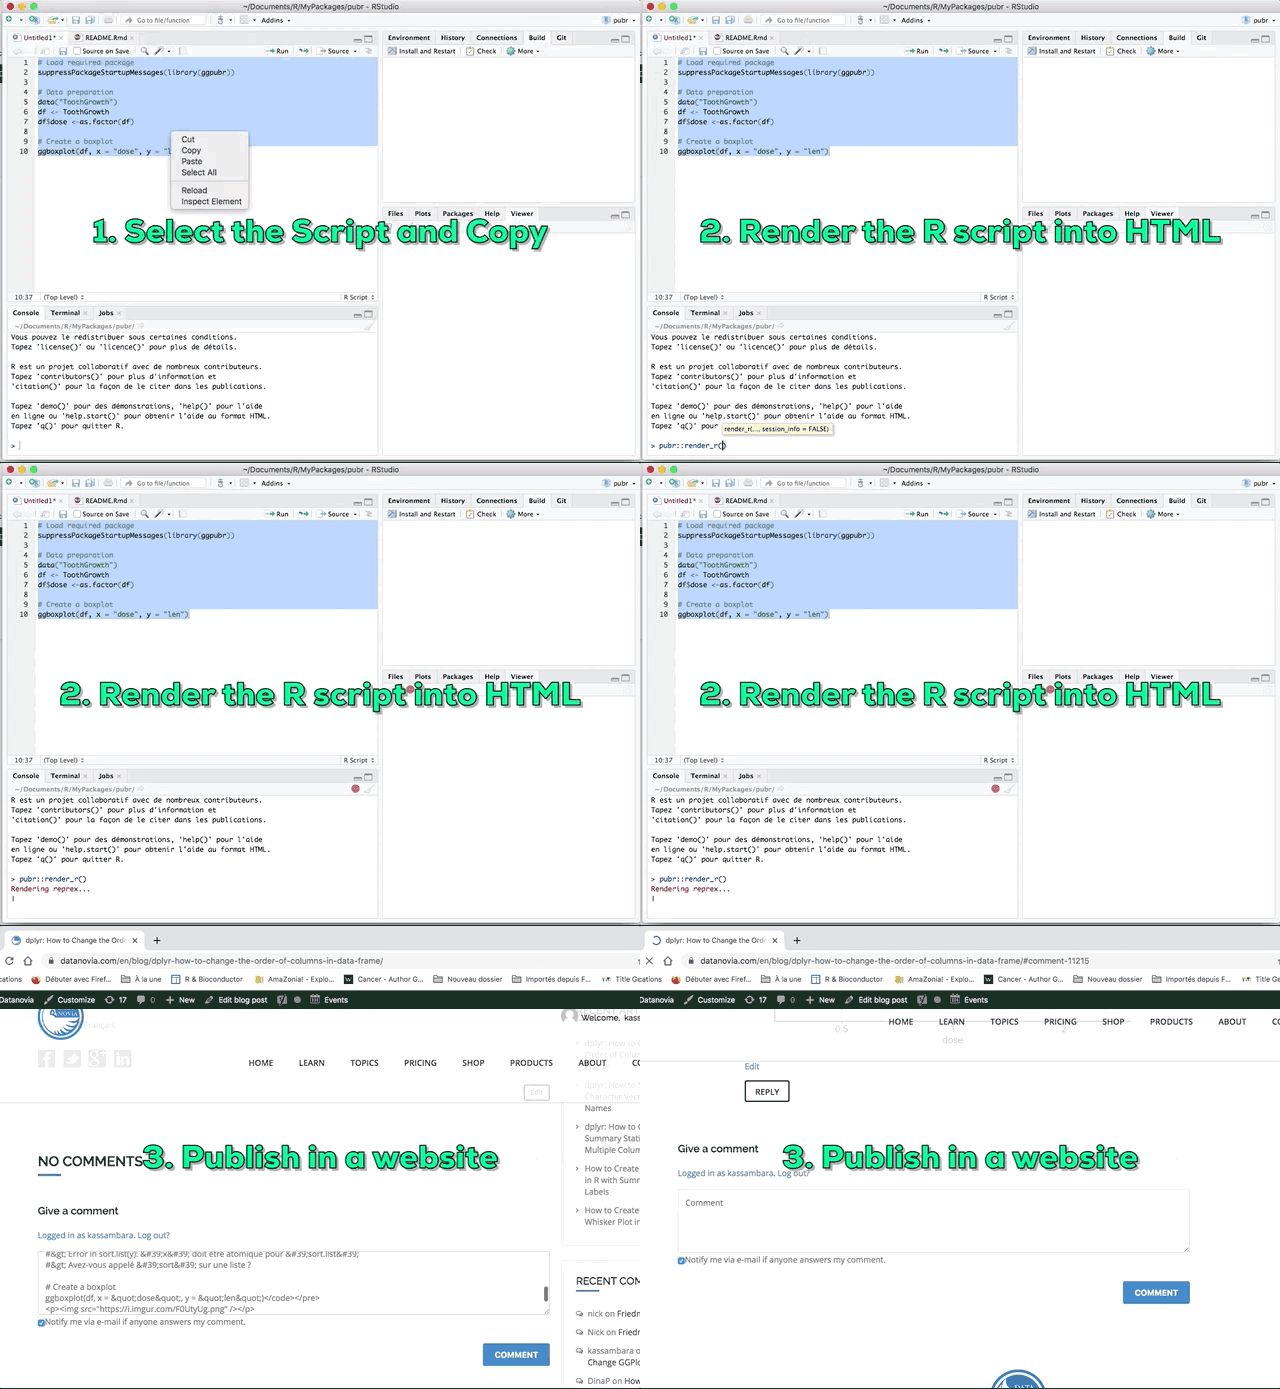
- Write a pure R script in Rstudio
- Select and copy the script
- Run
pubr::render_r(). The output of the rendered R script is a HTML block, which is automatically copied into the clipboard. - Paste into a website comment areas or into a blog post
# Load required package
suppressPackageStartupMessages(library(ggpubr))

# Data preparation
data("ToothGrowth")
df <- ToothGrowth
df$dose <-as.factor(df)

# Create a boxplot
ggboxplot(df, x = "dose", y = "len")
Example 2: Reproducible R script using data from clipboard
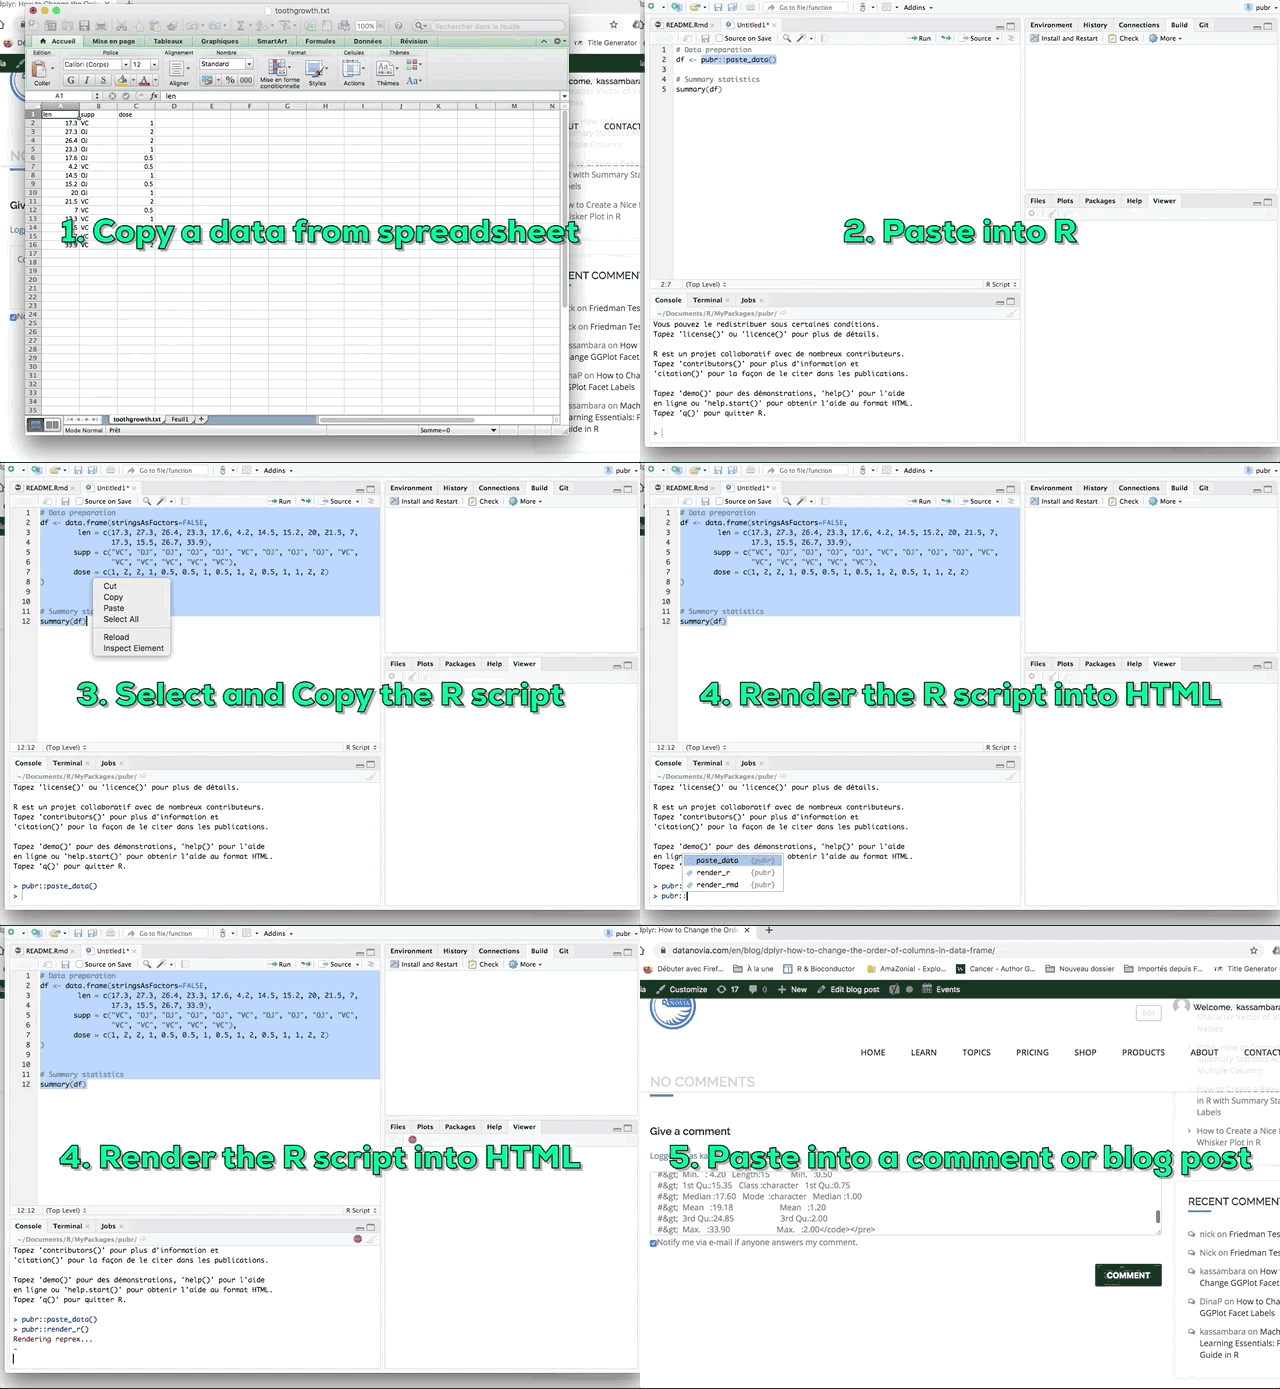
- Write a pure R script in Rstudio
- Copy the data from an Excel spreadsheet and paste it into R using the function
pubr::paste_data() - Select and copy the script
- Run
pubr::render_r(). The output of the rendered R script is a HTML block, which is automatically copied into the clipboard. - Paste into a website comment area or into a blog post
# Data preparation
df <- pubr::paste_data()

# Summary statistics
summary(df)
Example 3: Reproducible R script using external data file
- Write a pure R script in Rstudio
- Paste your data into R using the function
pubr::paste_data(data_file) - Select and copy the script
- Run
pubr::render_r(). The output of the rendered R script is a HTML block, which is automatically copied into the clipboard. - Paste into a website comment area or into a blog post
# Data preparation
data_file <-system.file("demo_data", "toothgrowth.txt", package = "pubr")
df <- pubr::paste_data(data_file)

# Create a boxplot
summary(df)
Example 4: Render a reproducible Rmd
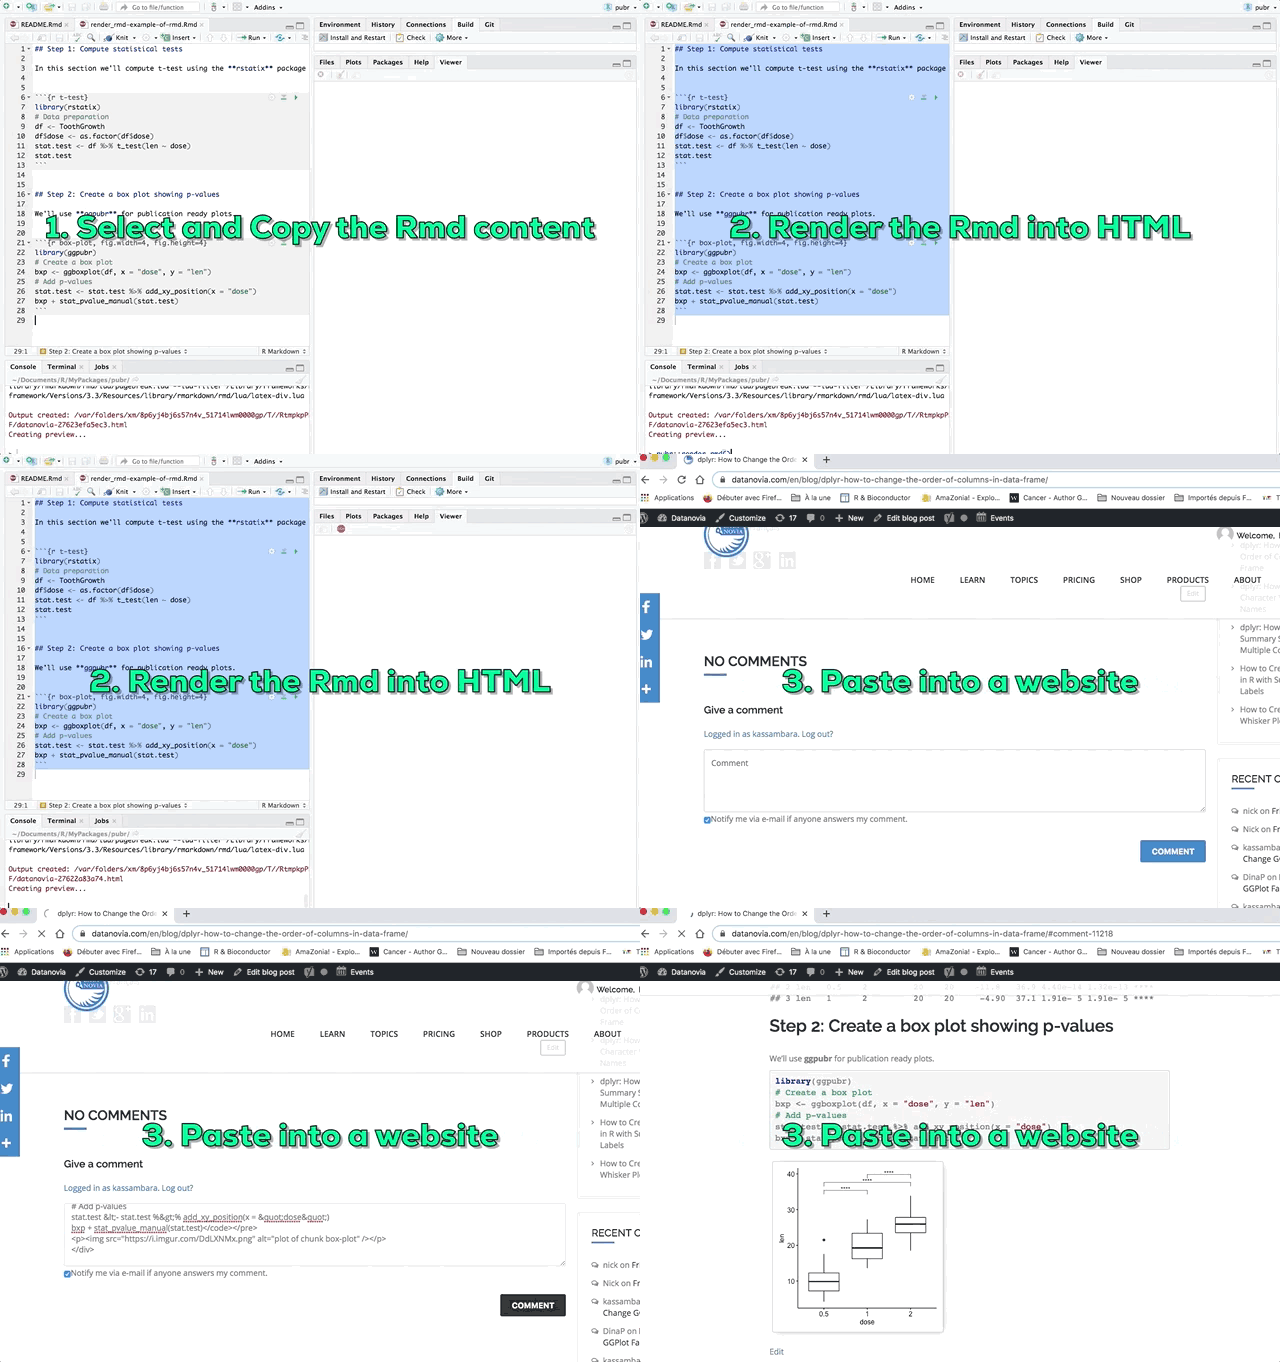
- Write an Rmd (without yaml header) from Rstudio
- Select and copy the Rmd content
- Run
pubr::render_rmd(). The output of the rendered Rmd content is a HTML block, which is automatically copied into the clipboard. - Paste into a website comment area or into a blog post

Recommended for you
This section contains best data science and self-development resources to help you on your path.
Books - Data Science
Our Books
- Practical Guide to Cluster Analysis in R by A. Kassambara (Datanovia)
- Practical Guide To Principal Component Methods in R by A. Kassambara (Datanovia)
- Machine Learning Essentials: Practical Guide in R by A. Kassambara (Datanovia)
- R Graphics Essentials for Great Data Visualization by A. Kassambara (Datanovia)
- GGPlot2 Essentials for Great Data Visualization in R by A. Kassambara (Datanovia)
- Network Analysis and Visualization in R by A. Kassambara (Datanovia)
- Practical Statistics in R for Comparing Groups: Numerical Variables by A. Kassambara (Datanovia)
- Inter-Rater Reliability Essentials: Practical Guide in R by A. Kassambara (Datanovia)
Others
- R for Data Science: Import, Tidy, Transform, Visualize, and Model Data by Hadley Wickham & Garrett Grolemund
- Hands-On Machine Learning with Scikit-Learn, Keras, and TensorFlow: Concepts, Tools, and Techniques to Build Intelligent Systems by Aurelien Géron
- Practical Statistics for Data Scientists: 50 Essential Concepts by Peter Bruce & Andrew Bruce
- Hands-On Programming with R: Write Your Own Functions And Simulations by Garrett Grolemund & Hadley Wickham
- An Introduction to Statistical Learning: with Applications in R by Gareth James et al.
- Deep Learning with R by François Chollet & J.J. Allaire
- Deep Learning with Python by François Chollet
Version:
 Français


Hi. I am trying this and I get the following:
> install.packages(“pubr”)
Warning in install.packages :
package ‘pubr’ is not available (for R version 3.6.3)
As indicated in the prerequisites, you can install the
pubrpackage as follow:i got the following error trying pubr::render_r()
R-3.6.1-intel> pubr::render_r()Error in reprex::reprex(..., style = TRUE, advertise = FALSE, venue = "html", :
unused argument (session_info = session_info)
I can’t install the packages requested packages in “Prerequisites”.
I tried this and I got the following:
install.packages(“devtools”)
Installing package into ‘C:/Users/Fernanda Anselmo/Documents/R/win-library/4.0’
(as ‘lib’ is unspecified)
— Please select a CRAN mirror for use in this session —
tentando a URL ‘https://cran-r.c3sl.ufpr.br/bin/windows/contrib/4.0/devtools_2.3.2.zip’
Content type ‘application/zip’ length 448412 bytes (437 KB)
downloaded 437 KB
package ‘devtools’ successfully unpacked and MD5 sums checked
The downloaded binary packages are in
C:\Users\Fernanda Anselmo\AppData\Local\Temp\RtmpS4OEUK\downloaded_packages
> devtools::install_github(“kassambara/pubr”)
Error in loadNamespace(j <- i[[1L]], c(lib.loc, .libPaths()), versionCheck = vI[[j]]) :
there is no package called ‘glue’