The divisive hierarchical clustering, also known as DIANA (DIvisive ANAlysis) is the inverse of agglomerative clustering .
This article introduces the divisive clustering algorithms and provides practical examples showing how to compute divise clustering using R.
Related Book
Practical Guide to Cluster Analysis in RAlgorithm
It starts by including all objects in a single large cluster. At each step of iteration, the most heterogeneous cluster is divided into two. The process is iterated until all objects are in their own cluster.
Recall that, divisive clustering is good at identifying large clusters while agglomerative clustering is good at identifying small clusters.
Computation
The R function diana() [cluster package] can be used to compute divisive clustering. It returns an object of class “diana” (see ?diana.object) which has also methods for the functions: print(), summary(), plot(), pltree(), as.dendrogram(), as.hclust() and cutree().
The output of DIANA can be visualized as dendrograms using the function fviz_dend() [factoextra package]. For example, the following R code shows how to computes and visualize divise clustering:
# Compute diana()
library(cluster)
res.diana <- diana(USArrests, stand = TRUE)

# Plot the dendrogram
library(factoextra)
fviz_dend(res.diana, cex = 0.5,
          k = 4, # Cut in four groups
          palette = "jco" # Color palette
          )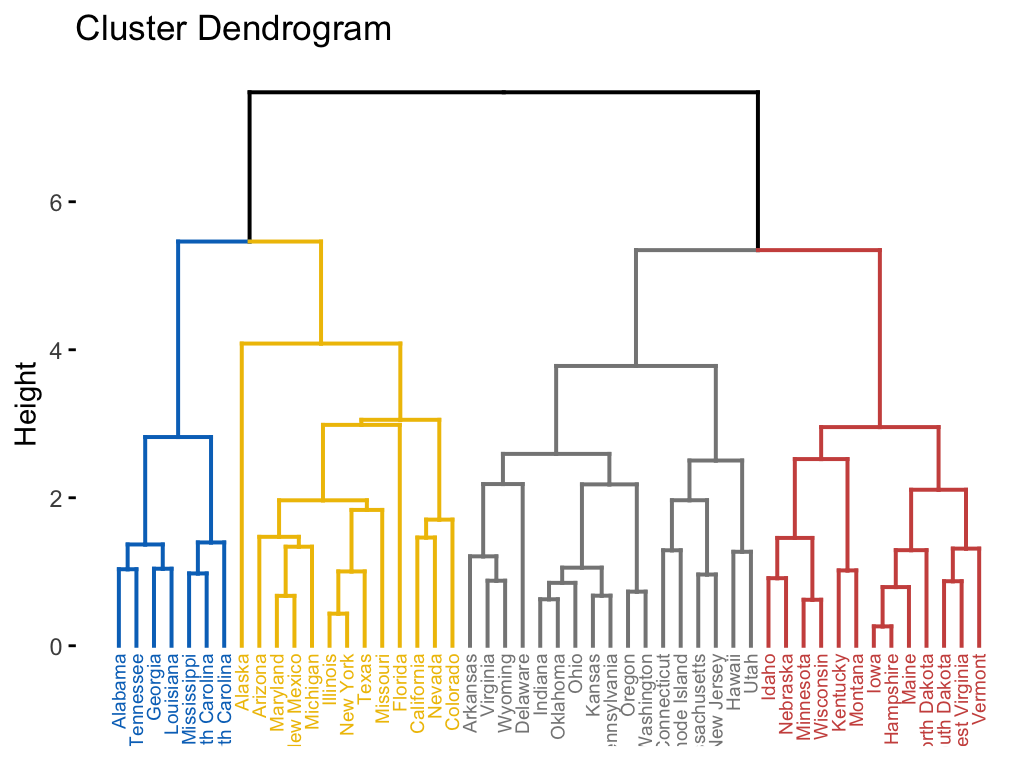
For interpreting dendrograms, read the “agglomerative clustering” chapter.
Recommended for you
This section contains best data science and self-development resources to help you on your path.
Books - Data Science
Our Books
- Practical Guide to Cluster Analysis in R by A. Kassambara (Datanovia)
- Practical Guide To Principal Component Methods in R by A. Kassambara (Datanovia)
- Machine Learning Essentials: Practical Guide in R by A. Kassambara (Datanovia)
- R Graphics Essentials for Great Data Visualization by A. Kassambara (Datanovia)
- GGPlot2 Essentials for Great Data Visualization in R by A. Kassambara (Datanovia)
- Network Analysis and Visualization in R by A. Kassambara (Datanovia)
- Practical Statistics in R for Comparing Groups: Numerical Variables by A. Kassambara (Datanovia)
- Inter-Rater Reliability Essentials: Practical Guide in R by A. Kassambara (Datanovia)
Others
- R for Data Science: Import, Tidy, Transform, Visualize, and Model Data by Hadley Wickham & Garrett Grolemund
- Hands-On Machine Learning with Scikit-Learn, Keras, and TensorFlow: Concepts, Tools, and Techniques to Build Intelligent Systems by Aurelien Géron
- Practical Statistics for Data Scientists: 50 Essential Concepts by Peter Bruce & Andrew Bruce
- Hands-On Programming with R: Write Your Own Functions And Simulations by Garrett Grolemund & Hadley Wickham
- An Introduction to Statistical Learning: with Applications in R by Gareth James et al.
- Deep Learning with R by François Chollet & J.J. Allaire
- Deep Learning with Python by François Chollet

No Comments