The fuzzy clustering is considered as soft clustering, in which each element has a probability of belonging to each cluster. In other words, each element has a set of membership coefficients corresponding to the degree of being in a given cluster.
This is different from k-means and k-medoid clustering, where each object is affected exactly to one cluster. K-means and k-medoids clustering are known as hard or non-fuzzy clustering.
In fuzzy clustering, points close to the center of a cluster, may be in the cluster to a higher degree than points in the edge of a cluster. The degree, to which an element belongs to a given cluster, is a numerical value varying from 0 to 1.
The fuzzy c-means (FCM) algorithm is one of the most widely used fuzzy clustering algorithms. The centroid of a cluster is calculated as the mean of all points, weighted by their degree of belonging to the cluster:
In this article, we’ll describe how to compute fuzzy clustering using the R software.
Related Book
Practical Guide to Cluster Analysis in RRequired R packages
We’ll use the following R packages: 1) cluster for computing fuzzy clustering and 2) factoextra for visualizing clusters.
Computing fuzzy clustering
The function fanny() [cluster R package] can be used to compute fuzzy clustering. FANNY stands for fuzzy analysis clustering. A simplified format is:
fanny(x, k, metric = "euclidean", stand = FALSE)- x: A data matrix or data frame or dissimilarity matrix
- k: The desired number of clusters to be generated
- metric: Metric for calculating dissimilarities between observations
- stand: If TRUE, variables are standardized before calculating the dissimilarities
The function fanny() returns an object including the following components:
- membership: matrix containing the degree to which each observation belongs to a given cluster. Column names are the clusters and rows are observations
- coeff: Dunn’s partition coefficient F(k) of the clustering, where k is the number of clusters. F(k) is the sum of all squared membership coefficients, divided by the number of observations. Its value is between 1/k and 1. The normalized form of the coefficient is also given. It is defined as \((F(k) - 1/k) / (1 - 1/k)\), and ranges between 0 and 1. A low value of Dunn’s coefficient indicates a very fuzzy clustering, whereas a value close to 1 indicates a near-crisp clustering.
- clustering: the clustering vector containing the nearest crisp grouping of observations
For example, the R code below applies fuzzy clustering on the USArrests data set:
library(cluster)
df <- scale(USArrests)     # Standardize the data
res.fanny <- fanny(df, 2)  # Compute fuzzy clustering with k = 2
The different components can be extracted using the code below:
head(res.fanny$membership, 3) # Membership coefficients## [,1] [,2]
## Alabama 0.664 0.336
## Alaska 0.610 0.390
## Arizona 0.686 0.314res.fanny$coeff # Dunn's partition coefficient## dunn_coeff normalized
## 0.555 0.109head(res.fanny$clustering) # Observation groups## Alabama Alaska Arizona Arkansas California Colorado
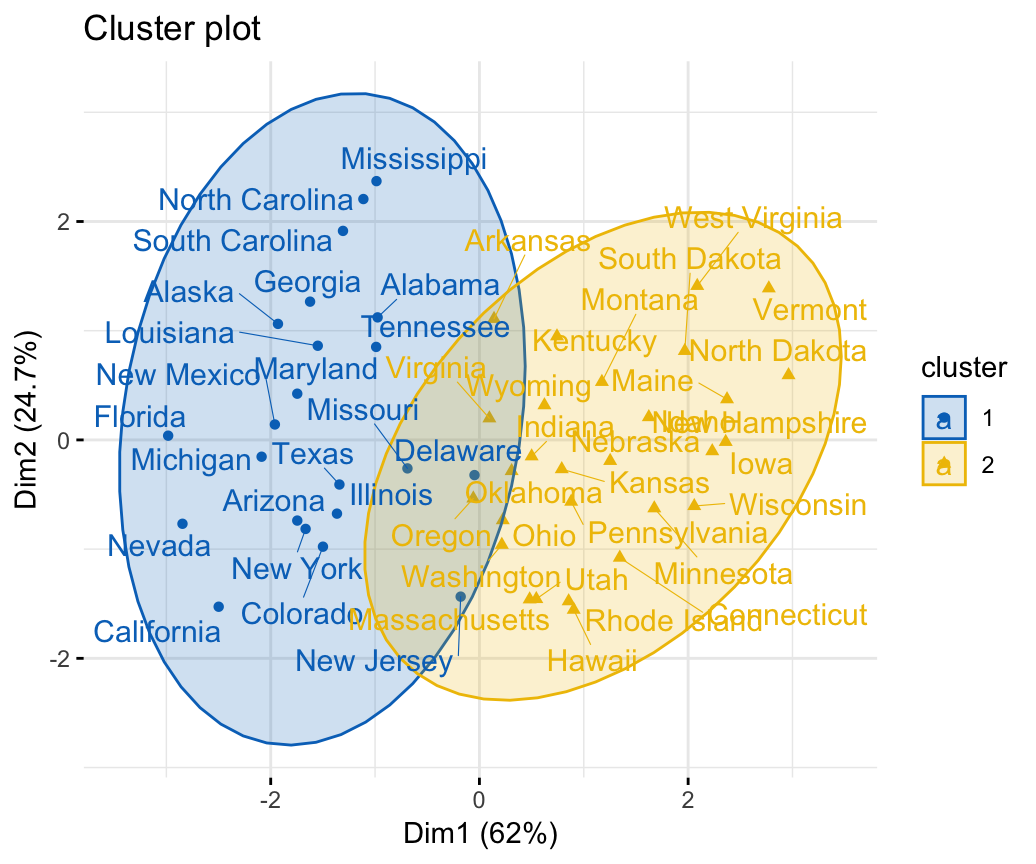
## 1 1 1 2 1 1To visualize observation groups, use the function fviz_cluster() [factoextra package]:
library(factoextra)
fviz_cluster(res.fanny, ellipse.type = "norm", repel = TRUE,
             palette = "jco", ggtheme = theme_minimal(),
             legend = "right")
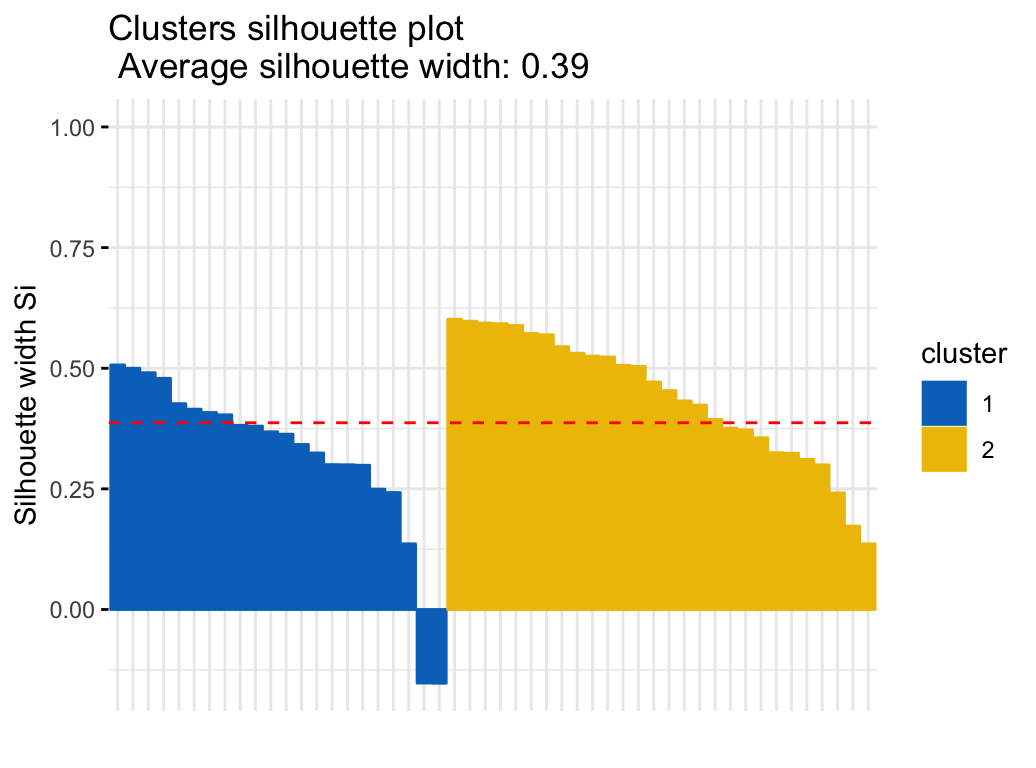
To evaluate the goodnesss of the clustering results, plot the silhouette coefficient as follow:
fviz_silhouette(res.fanny, palette = "jco",
                ggtheme = theme_minimal())
## cluster size ave.sil.width
## 1 1 22 0.32
## 2 2 28 0.44
Summary
Fuzzy clustering is an alternative to k-means clustering, where each data point has membership coefficient to each cluster. Here, we demonstrated how to compute and visualize fuzzy clustering using the combination of cluster and factoextra R packages.
Recommended for you
This section contains best data science and self-development resources to help you on your path.
Books - Data Science
Our Books
- Practical Guide to Cluster Analysis in R by A. Kassambara (Datanovia)
- Practical Guide To Principal Component Methods in R by A. Kassambara (Datanovia)
- Machine Learning Essentials: Practical Guide in R by A. Kassambara (Datanovia)
- R Graphics Essentials for Great Data Visualization by A. Kassambara (Datanovia)
- GGPlot2 Essentials for Great Data Visualization in R by A. Kassambara (Datanovia)
- Network Analysis and Visualization in R by A. Kassambara (Datanovia)
- Practical Statistics in R for Comparing Groups: Numerical Variables by A. Kassambara (Datanovia)
- Inter-Rater Reliability Essentials: Practical Guide in R by A. Kassambara (Datanovia)
Others
- R for Data Science: Import, Tidy, Transform, Visualize, and Model Data by Hadley Wickham & Garrett Grolemund
- Hands-On Machine Learning with Scikit-Learn, Keras, and TensorFlow: Concepts, Tools, and Techniques to Build Intelligent Systems by Aurelien Géron
- Practical Statistics for Data Scientists: 50 Essential Concepts by Peter Bruce & Andrew Bruce
- Hands-On Programming with R: Write Your Own Functions And Simulations by Garrett Grolemund & Hadley Wickham
- An Introduction to Statistical Learning: with Applications in R by Gareth James et al.
- Deep Learning with R by François Chollet & J.J. Allaire
- Deep Learning with Python by François Chollet


Hello, Can a fuzzy cluster be made with a dissimilarity matrix (gower)?, thanks