K-means represents one of the most popular clustering algorithm. However, it has some limitations: it requires the user to specify the number of clusters in advance and selects initial centroids randomly. The final k-means clustering solution is very sensitive to this initial random selection of cluster centers. The result might be (slightly) different each time you compute k-means.
In this chapter, we described an hybrid method, named hierarchical k-means clustering (hkmeans), for improving k-means results.
Contents:
Related Book
Practical Guide to Cluster Analysis in RAlgorithm
The algorithm is summarized as follow:
- Compute hierarchical clustering and cut the tree into k-clusters
- Compute the center (i.e the mean) of each cluster
- Compute k-means by using the set of cluster centers (defined in step 2) as the initial cluster centers
Note that, k-means algorithm will improve the initial partitioning generated at the step 2 of the algorithm. Hence, the initial partitioning can be slightly different from the final partitioning obtained in the step 4.
R code
The R function hkmeans() [in factoextra], provides an easy solution to compute the hierarchical k-means clustering. The format of the result is similar to the one provided by the standard kmeans() function (see Chapter @ref(kmeans-clustering)).
To install factoextra, type this: install.packages(“factoextra”).
We’ll use the USArrest data set and we start by standardizing the data:
df <- scale(USArrests)# Compute hierarchical k-means clustering
library(factoextra)
res.hk <-hkmeans(df, 4)
# Elements returned by hkmeans()
names(res.hk)## [1] "cluster" "centers" "totss" "withinss"
## [5] "tot.withinss" "betweenss" "size" "iter"
## [9] "ifault" "data" "hclust"To print all the results, type this:
# Print the results
res.hk
# Visualize the tree
fviz_dend(res.hk, cex = 0.6, palette = "jco",
rect = TRUE, rect_border = "jco", rect_fill = TRUE)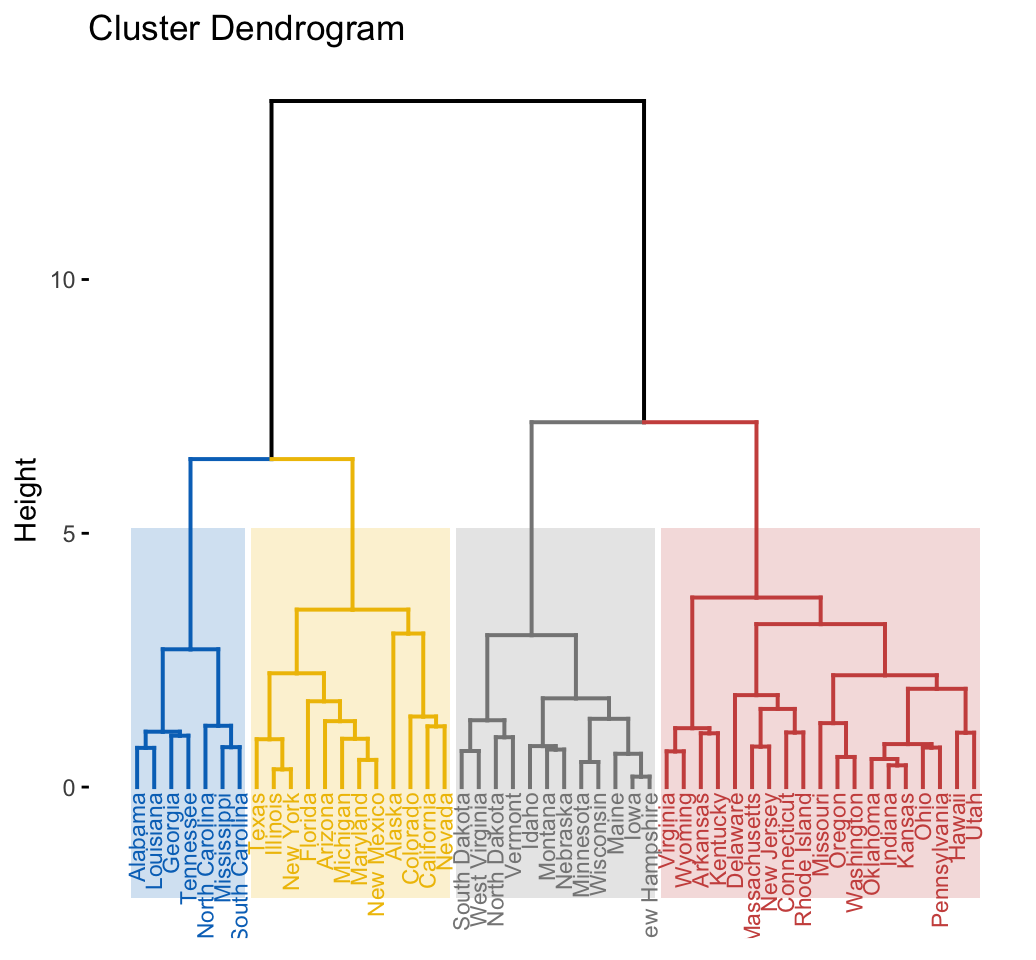
# Visualize the hkmeans final clusters
fviz_cluster(res.hk, palette = "jco", repel = TRUE,
             ggtheme = theme_classic())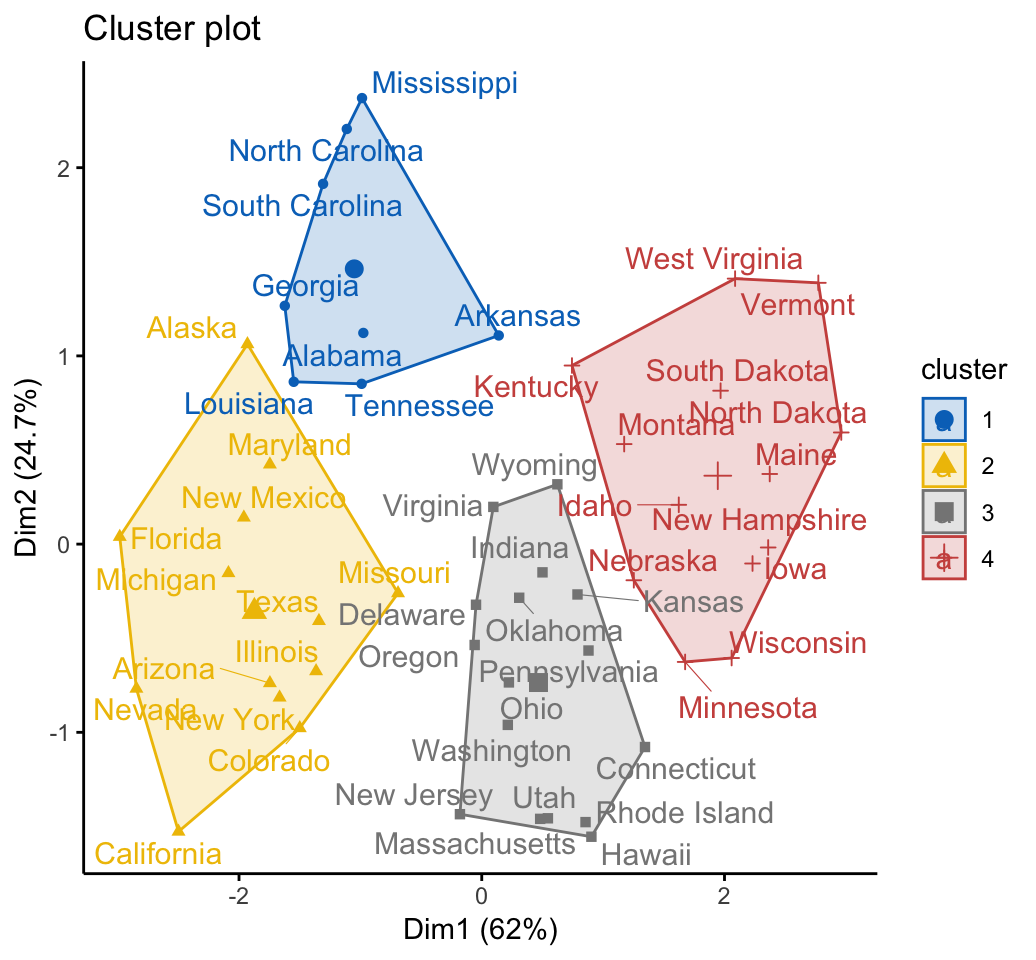
Summary
We described hybrid hierarchical k-means clustering for improving k-means results.
Recommended for you
This section contains best data science and self-development resources to help you on your path.
Books - Data Science
Our Books
- Practical Guide to Cluster Analysis in R by A. Kassambara (Datanovia)
- Practical Guide To Principal Component Methods in R by A. Kassambara (Datanovia)
- Machine Learning Essentials: Practical Guide in R by A. Kassambara (Datanovia)
- R Graphics Essentials for Great Data Visualization by A. Kassambara (Datanovia)
- GGPlot2 Essentials for Great Data Visualization in R by A. Kassambara (Datanovia)
- Network Analysis and Visualization in R by A. Kassambara (Datanovia)
- Practical Statistics in R for Comparing Groups: Numerical Variables by A. Kassambara (Datanovia)
- Inter-Rater Reliability Essentials: Practical Guide in R by A. Kassambara (Datanovia)
Others
- R for Data Science: Import, Tidy, Transform, Visualize, and Model Data by Hadley Wickham & Garrett Grolemund
- Hands-On Machine Learning with Scikit-Learn, Keras, and TensorFlow: Concepts, Tools, and Techniques to Build Intelligent Systems by Aurelien Géron
- Practical Statistics for Data Scientists: 50 Essential Concepts by Peter Bruce & Andrew Bruce
- Hands-On Programming with R: Write Your Own Functions And Simulations by Garrett Grolemund & Hadley Wickham
- An Introduction to Statistical Learning: with Applications in R by Gareth James et al.
- Deep Learning with R by François Chollet & J.J. Allaire
- Deep Learning with Python by François Chollet

Dear Alboukadel
If I were to use hierarchical k-means clustering, what function method should I use in the eclust function when doing cluster validation to initialise the function?
Hi Bryan,
In the current version of factoextra, the hkmeans method is not implemented in the eclust() function.
I created an issue on github: https://github.com/kassambara/factoextra/issues/78
Hello, I have a practical question. I need to classify salinity zones for the estuarine environment. There is a theoretical classification (Venice System) that defines four zones,
Euhalina (40 ~ 30),
Polyhalina (30 ~ 18),
Mesohalina (18 ~ 5),
Oligohalina (5 ~ 0.5).
I have data collected over the salinity gradient at different periods and would like to apply this classification to my ecosystems. In the real world, there is some overlap in tidal zone edges, but I still find it interesting to try to apply some clustering technique to these systems. What I imagine I need is an algorithm that classifies the zones of each system and that I provide the rating ranges. That is, I have points in space that have different salinity values and I would like to group them according to a rule (based on intervals) defined by me. Would you have something to suggest me?
how can I do a cluster validation analysis of the clusters obtained by hkmeans ?
I tried using fviz_silhouette, but I get an error message saying that hkmeans objects are not supported by fviz_silhouette.