Hello, Datanovia
Learn and apply Python in data science with our interactive tutorials. From basic programming to advanced machine learning, we provide a comprehensive path to mastering Python in data science.


Embrace the power of R in data science with our structured courses. Learn to analyze, visualize, and model data effectively using R, with practical projects to solidify your skills.
---
title: "ggplot2 demo"
author: "Norah Jones"
date: "5/22/2021"
format:
  html:
    fig-width: 8
    fig-height: 4
    code-fold: true
---

## Air Quality

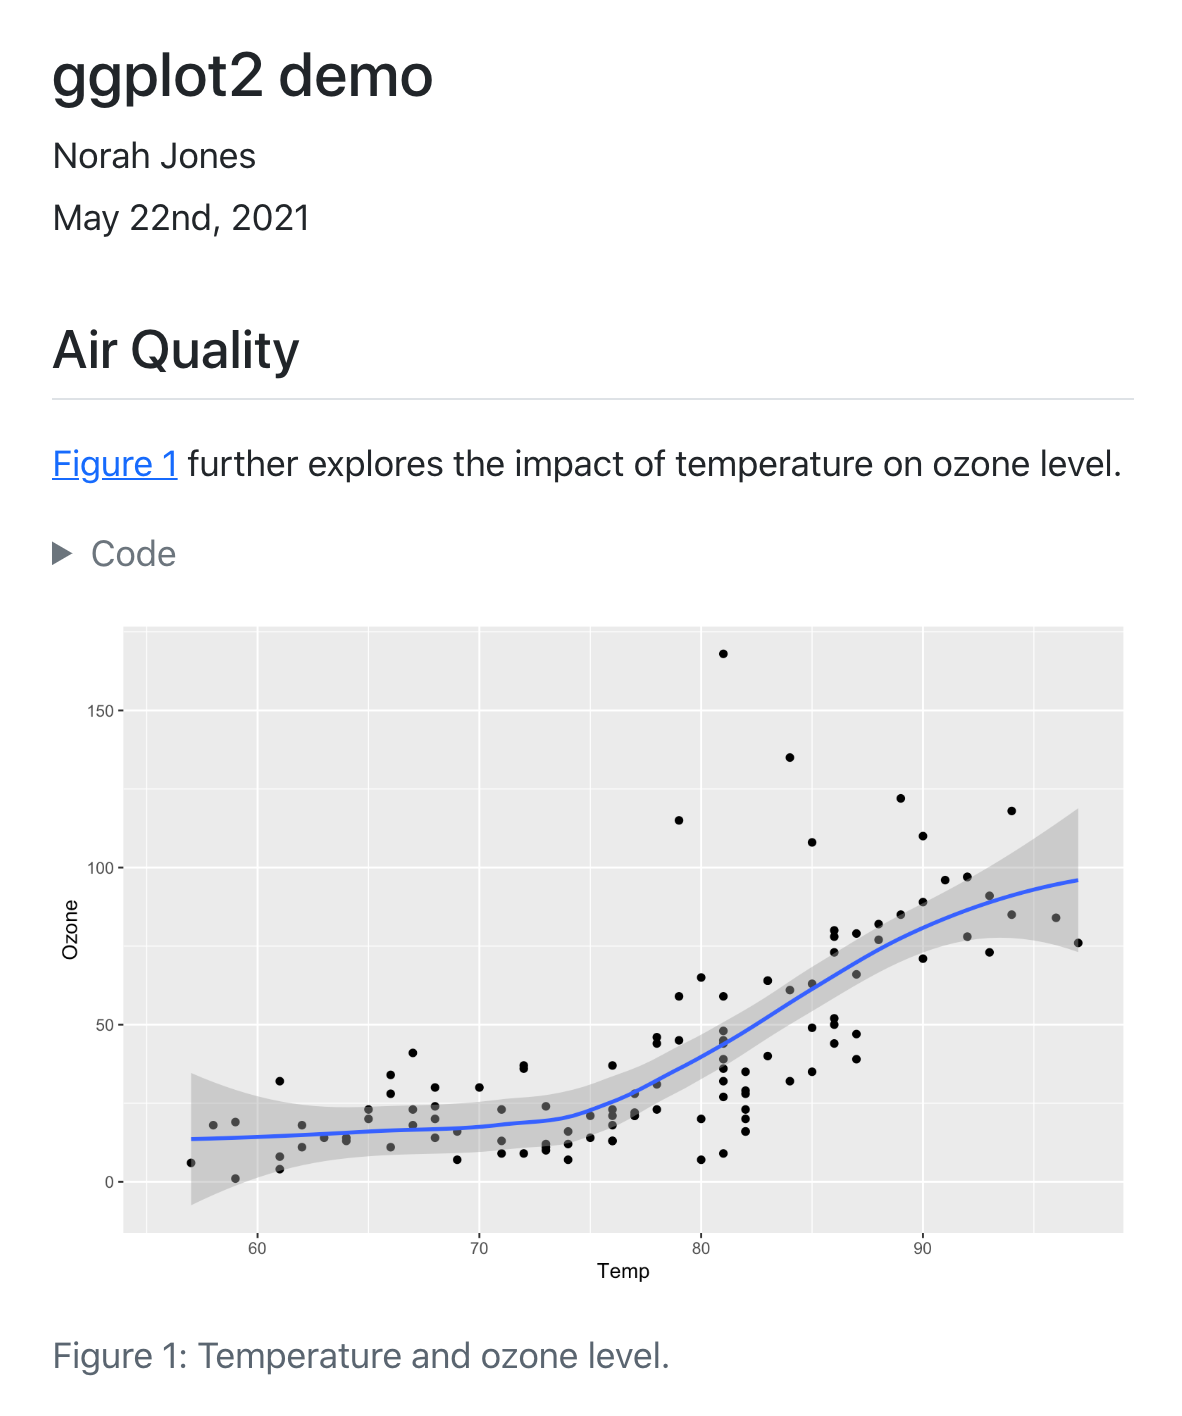
@fig-airquality further explores the impact of temperature on ozone level.

```{r}
#| label: fig-airquality
#| fig-cap: "Temperature and ozone level."
#| warning: false

library(ggplot2)
ggplot(airquality, aes(Temp, Ozone)) +
  geom_point() +
  geom_smooth(method = "loess")
```

Practical Learning
Engage in practical learning experiences with Python and R, tailored to translate complex data into actionable insights. Dive deep into data manipulation, statistical modeling, and machine learning through hands-on exercises and real-life scenarios.
Comprehensive Resources
Access a wealth of resources including datasets, eBooks, and project guides to support your data science journey. From beginner to advanced levels, find materials that cater to every stage of learning.
Real-World Case Studies
Explore real-world applications and case studies, bridging the gap between theory and practice in data science.
Bioinformatics Expertise
Gain expertise in bioinformatics, specializing in genomic data analysis and biostatistics for precision healthcare. Delve into the world of DNA sequencing, gene expression analysis, and much more.
Python for Data Analysis
Unlock the power of Python for data analysis. Learn how to manipulate and analyze data using pandas, visualize data with Matplotlib, and apply statistical techniques with SciPy.
R for Statistical Computing
Discover the strengths of R in statistical analysis. Dive into R’s world for hypothesis testing, regression models, and data wrangling with dplyr and tidyr.
Machine Learning Essentials
Master fundamental machine learning concepts using Python and R. From linear regression to neural networks, start your journey in predictive modeling and AI.
